Fig. 14
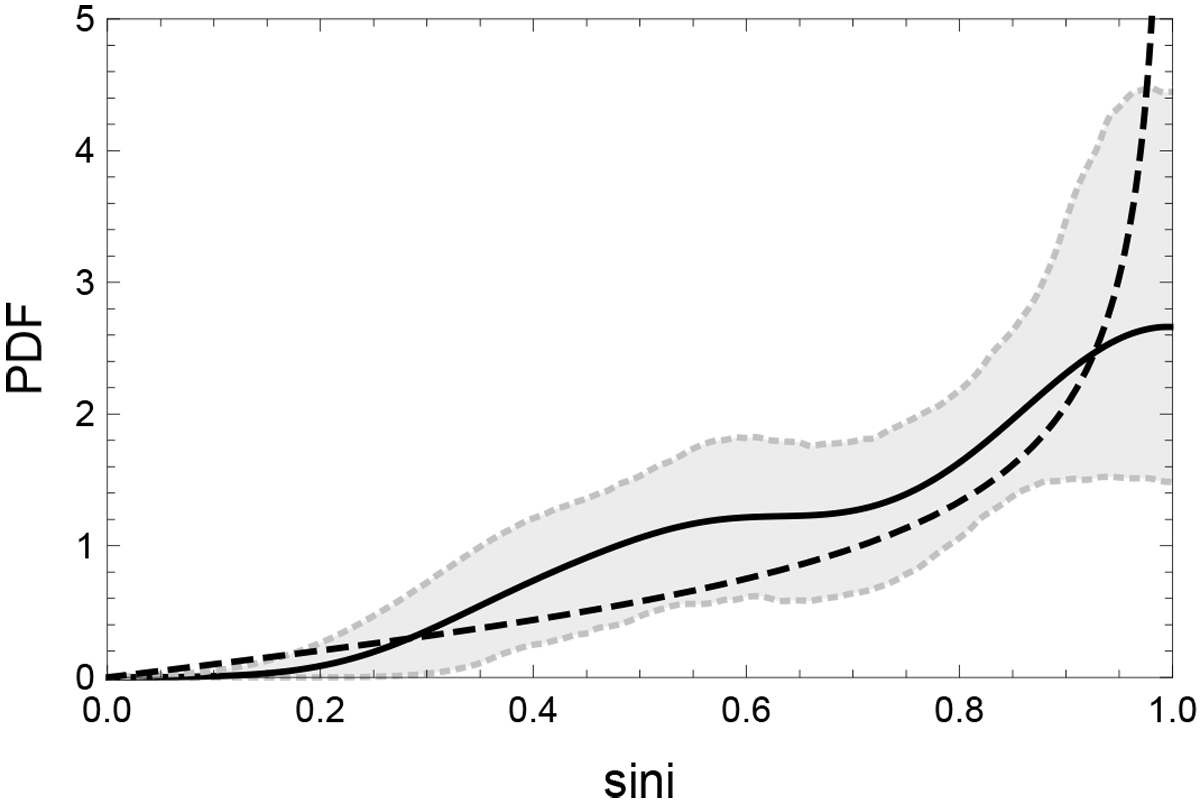
PDF (solid black line) generated from our N = 25 data sample. It was calculated using a standard KDE algorithm with a Gaussian kernel and a Silverman’s bandwidth of 0.1029. The 95% confidence interval is shown in the shaded gray region and was calculated using the quantiles from 2000 bootstrap samples of length N = 25. The theoretical PDF f(s) function is shown as a dashed line.
Current usage metrics show cumulative count of Article Views (full-text article views including HTML views, PDF and ePub downloads, according to the available data) and Abstracts Views on Vision4Press platform.
Data correspond to usage on the plateform after 2015. The current usage metrics is available 48-96 hours after online publication and is updated daily on week days.
Initial download of the metrics may take a while.