Fig. 1
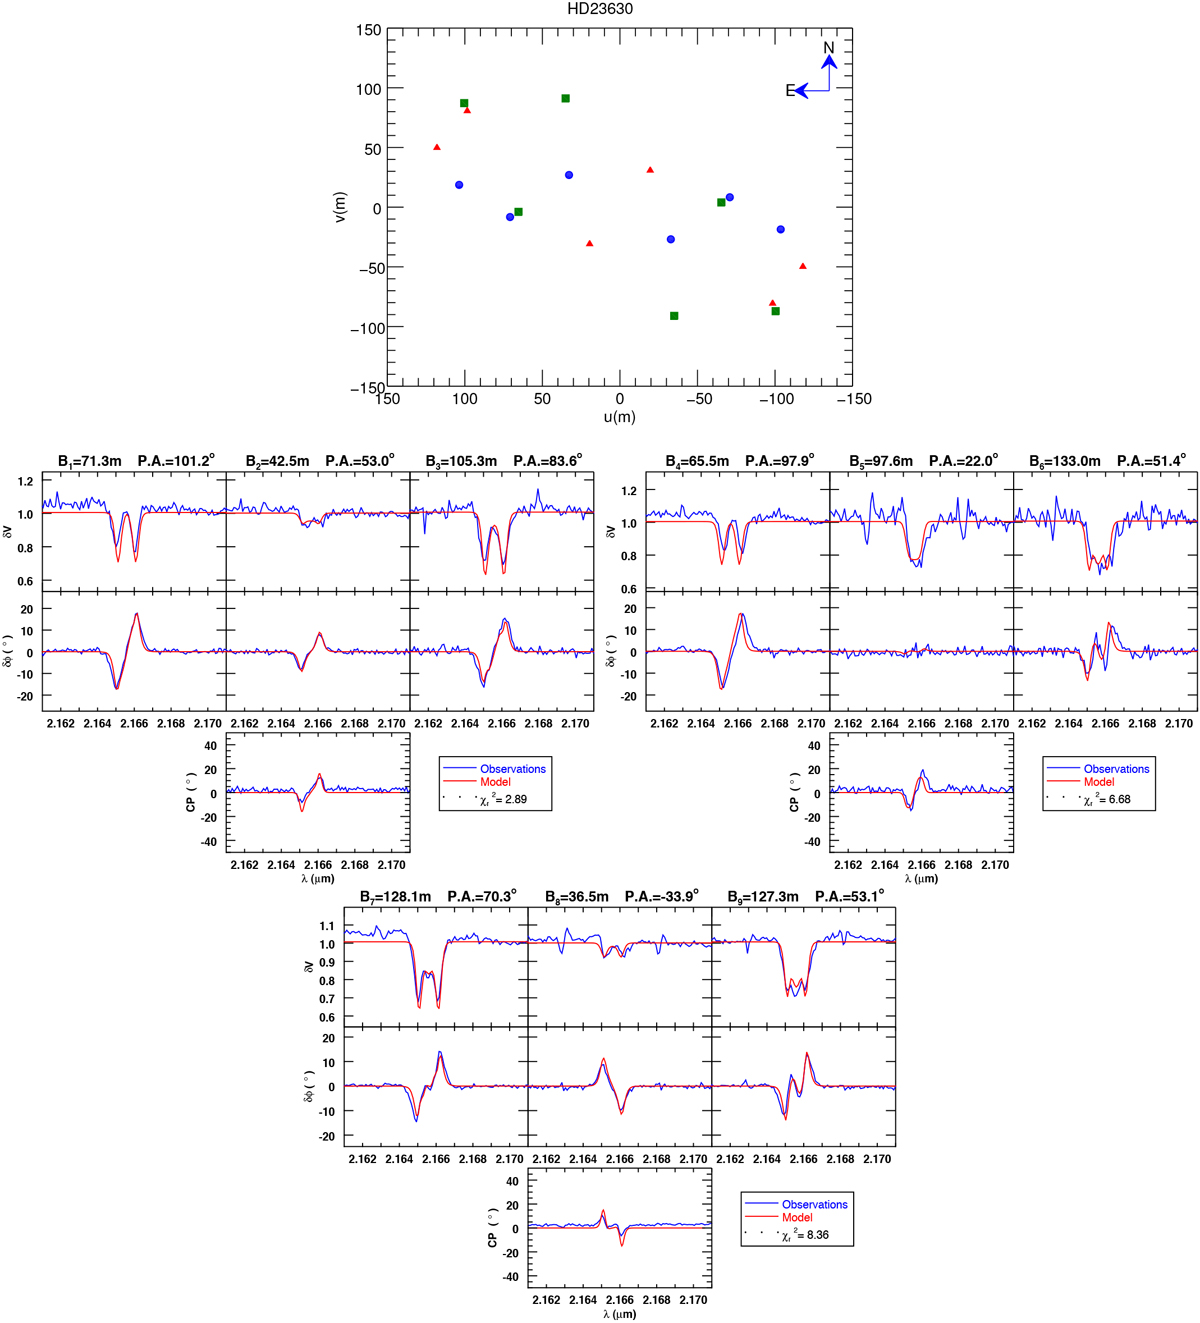
HD 23630: (u, v) plan coverage, differential visibilities (δV), differential phases (δϕ) and closure phases (CP) from our HR measurements. Each observation in the (u, v) plane, i.e., three baseline measurements, is plotted with a different color and symbol: blue circles correspond to the baselines B1–B3; green squares to baselines B4–B6; red triangles to baselines B7–B9; purple diamonds to baselines B10–B12; pink hexagons to baselines B13–B15; cyan pentagons to baselines B16–B18; orange thin diamonds to baselines B19–B21. See description in Sect. 4.
Current usage metrics show cumulative count of Article Views (full-text article views including HTML views, PDF and ePub downloads, according to the available data) and Abstracts Views on Vision4Press platform.
Data correspond to usage on the plateform after 2015. The current usage metrics is available 48-96 hours after online publication and is updated daily on week days.
Initial download of the metrics may take a while.