Fig. 8.
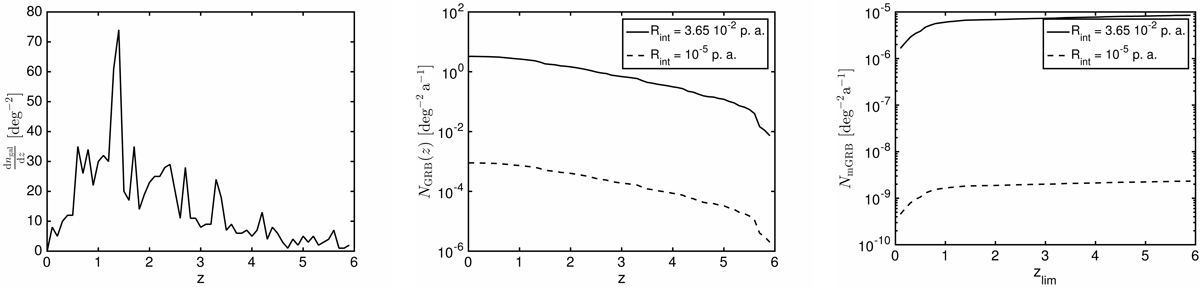
Left panel: distribution of observable GRB starburst host galaxies with total flux above 10 μJy at 1.4 GHz per square degree, per redshift, dngal(z)/dz, in redshift bins of 0.1 width taken from the SKA Simulated Skies. Middle panel: integrated number of observable GRBs per square degree per year from z to zlim = 6 assuming an internal emission rate of Rint = 10−4 per galaxy per day (solid line) or Rint = 10−5 per galaxy per year (dashed line). Right panel: integrated number of observable multiply imaged GRBs per square degree per year out to zlim from 0.1 to 6.0 according to Eq. (6).
Current usage metrics show cumulative count of Article Views (full-text article views including HTML views, PDF and ePub downloads, according to the available data) and Abstracts Views on Vision4Press platform.
Data correspond to usage on the plateform after 2015. The current usage metrics is available 48-96 hours after online publication and is updated daily on week days.
Initial download of the metrics may take a while.