Fig. 7.
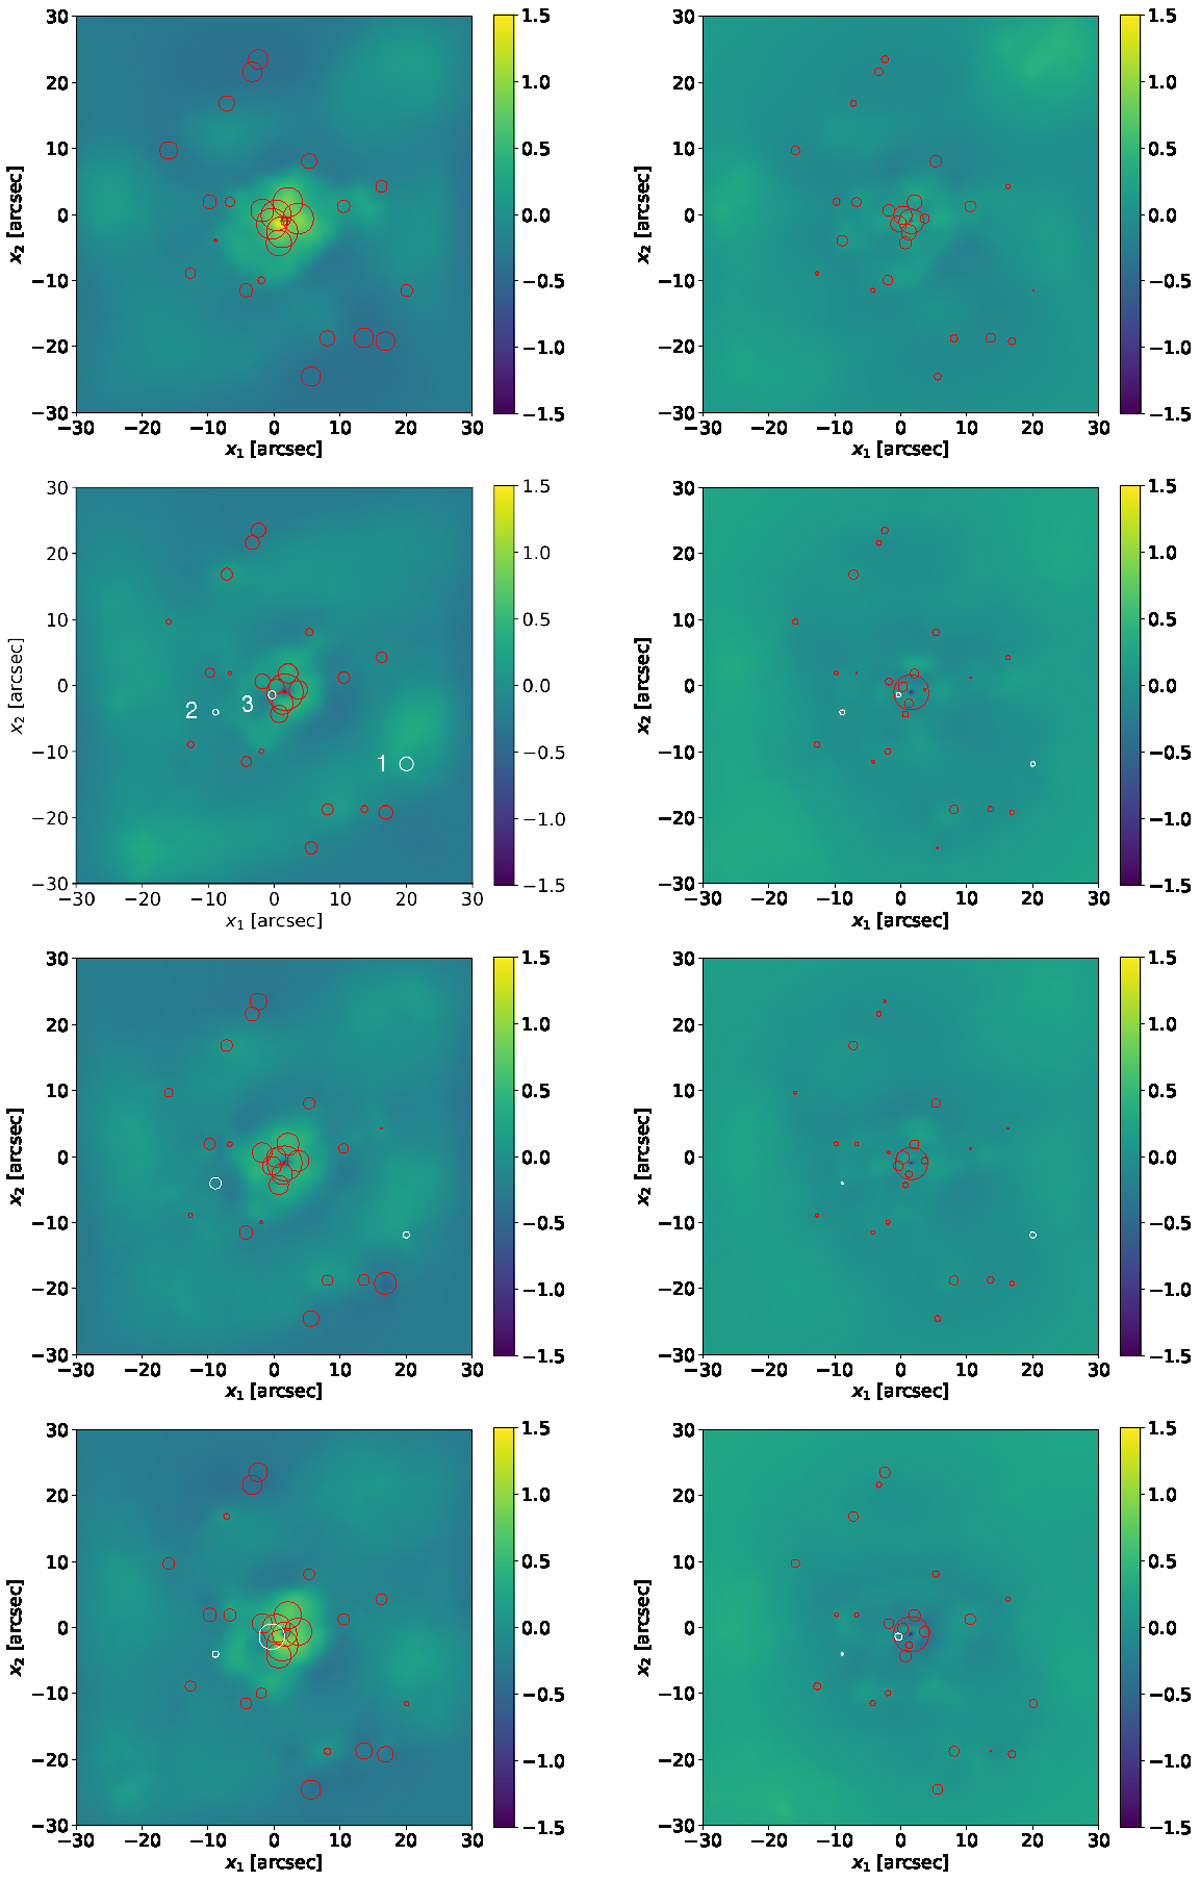
Comparison between Grale lens models for the simulated, generalised NFW profile that is detailed in Liesenborgs & De Rijcke (2012). Each map shows the difference between the reconstructed convergence map and the simulation result for the models with the same constraints as detailed in Table 1 and Fig. 5. The circles mark the positions of the multiple images and their size is proportional to the difference between the reconstructed and real convergence at these positions. The white circles indicate the multiple images with the time-delay constraints. For the multiple images marked by red circles, no time-delay constraint is given.
Current usage metrics show cumulative count of Article Views (full-text article views including HTML views, PDF and ePub downloads, according to the available data) and Abstracts Views on Vision4Press platform.
Data correspond to usage on the plateform after 2015. The current usage metrics is available 48-96 hours after online publication and is updated daily on week days.
Initial download of the metrics may take a while.