Fig. 6.
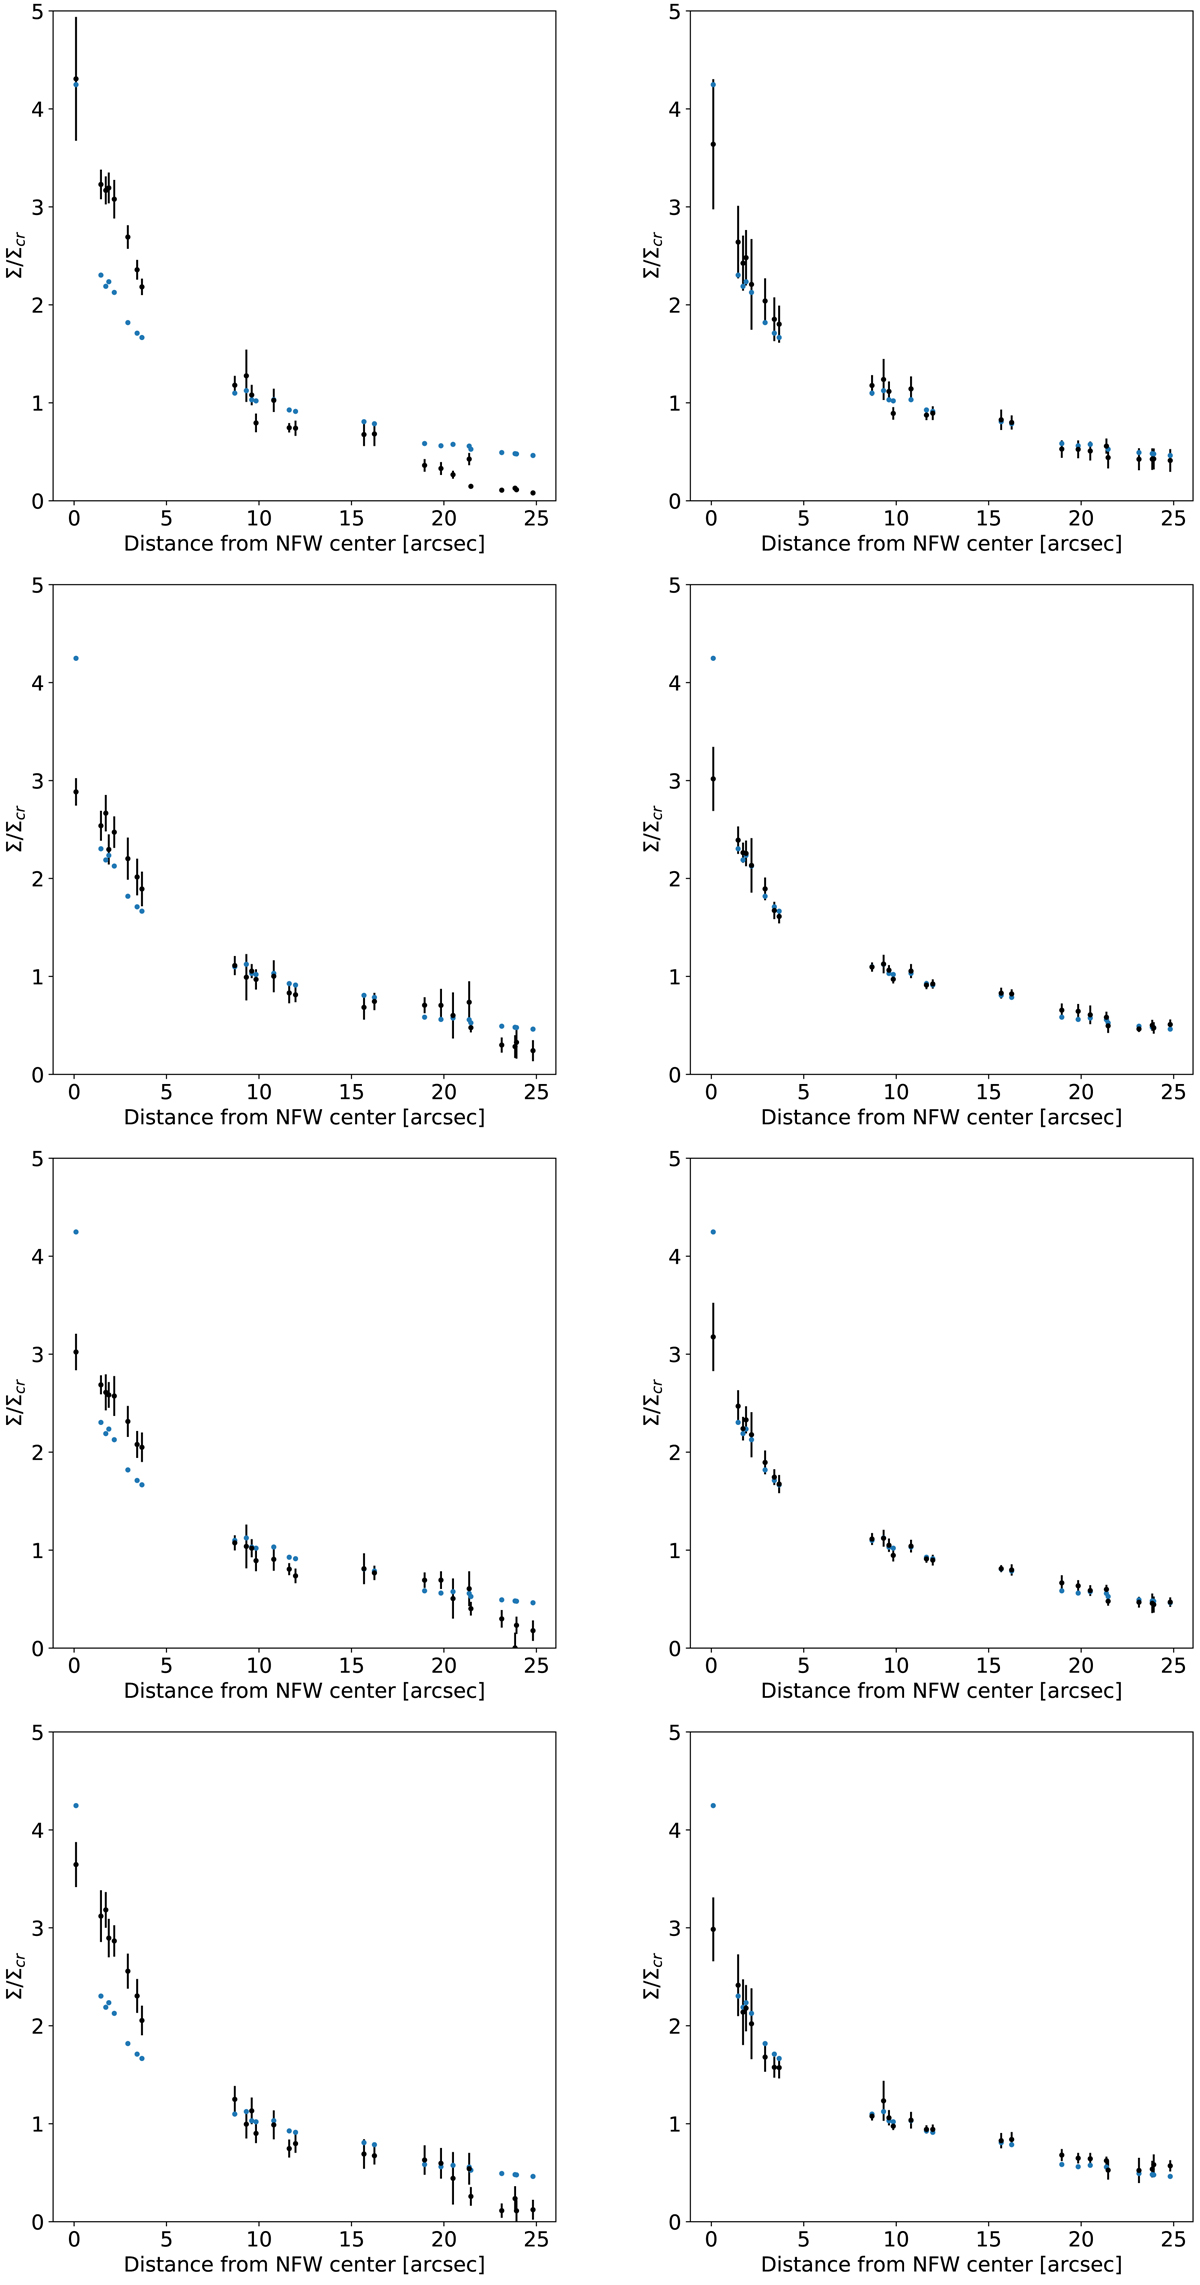
Comparison between Grale lens models for the simulated, generalised NFW profile that is detailed in Liesenborgs & De Rijcke (2012). Each plot shows the reconstructed convergence values and their uncertainties (black points with error bars) and the true convergence values (blue points) at the positions of the multiple images measured as radial distance from the centre of the NFW profile for the Grale models with the same constraints as detailed in Table 1 and Fig. 5.
Current usage metrics show cumulative count of Article Views (full-text article views including HTML views, PDF and ePub downloads, according to the available data) and Abstracts Views on Vision4Press platform.
Data correspond to usage on the plateform after 2015. The current usage metrics is available 48-96 hours after online publication and is updated daily on week days.
Initial download of the metrics may take a while.