Fig. 5.
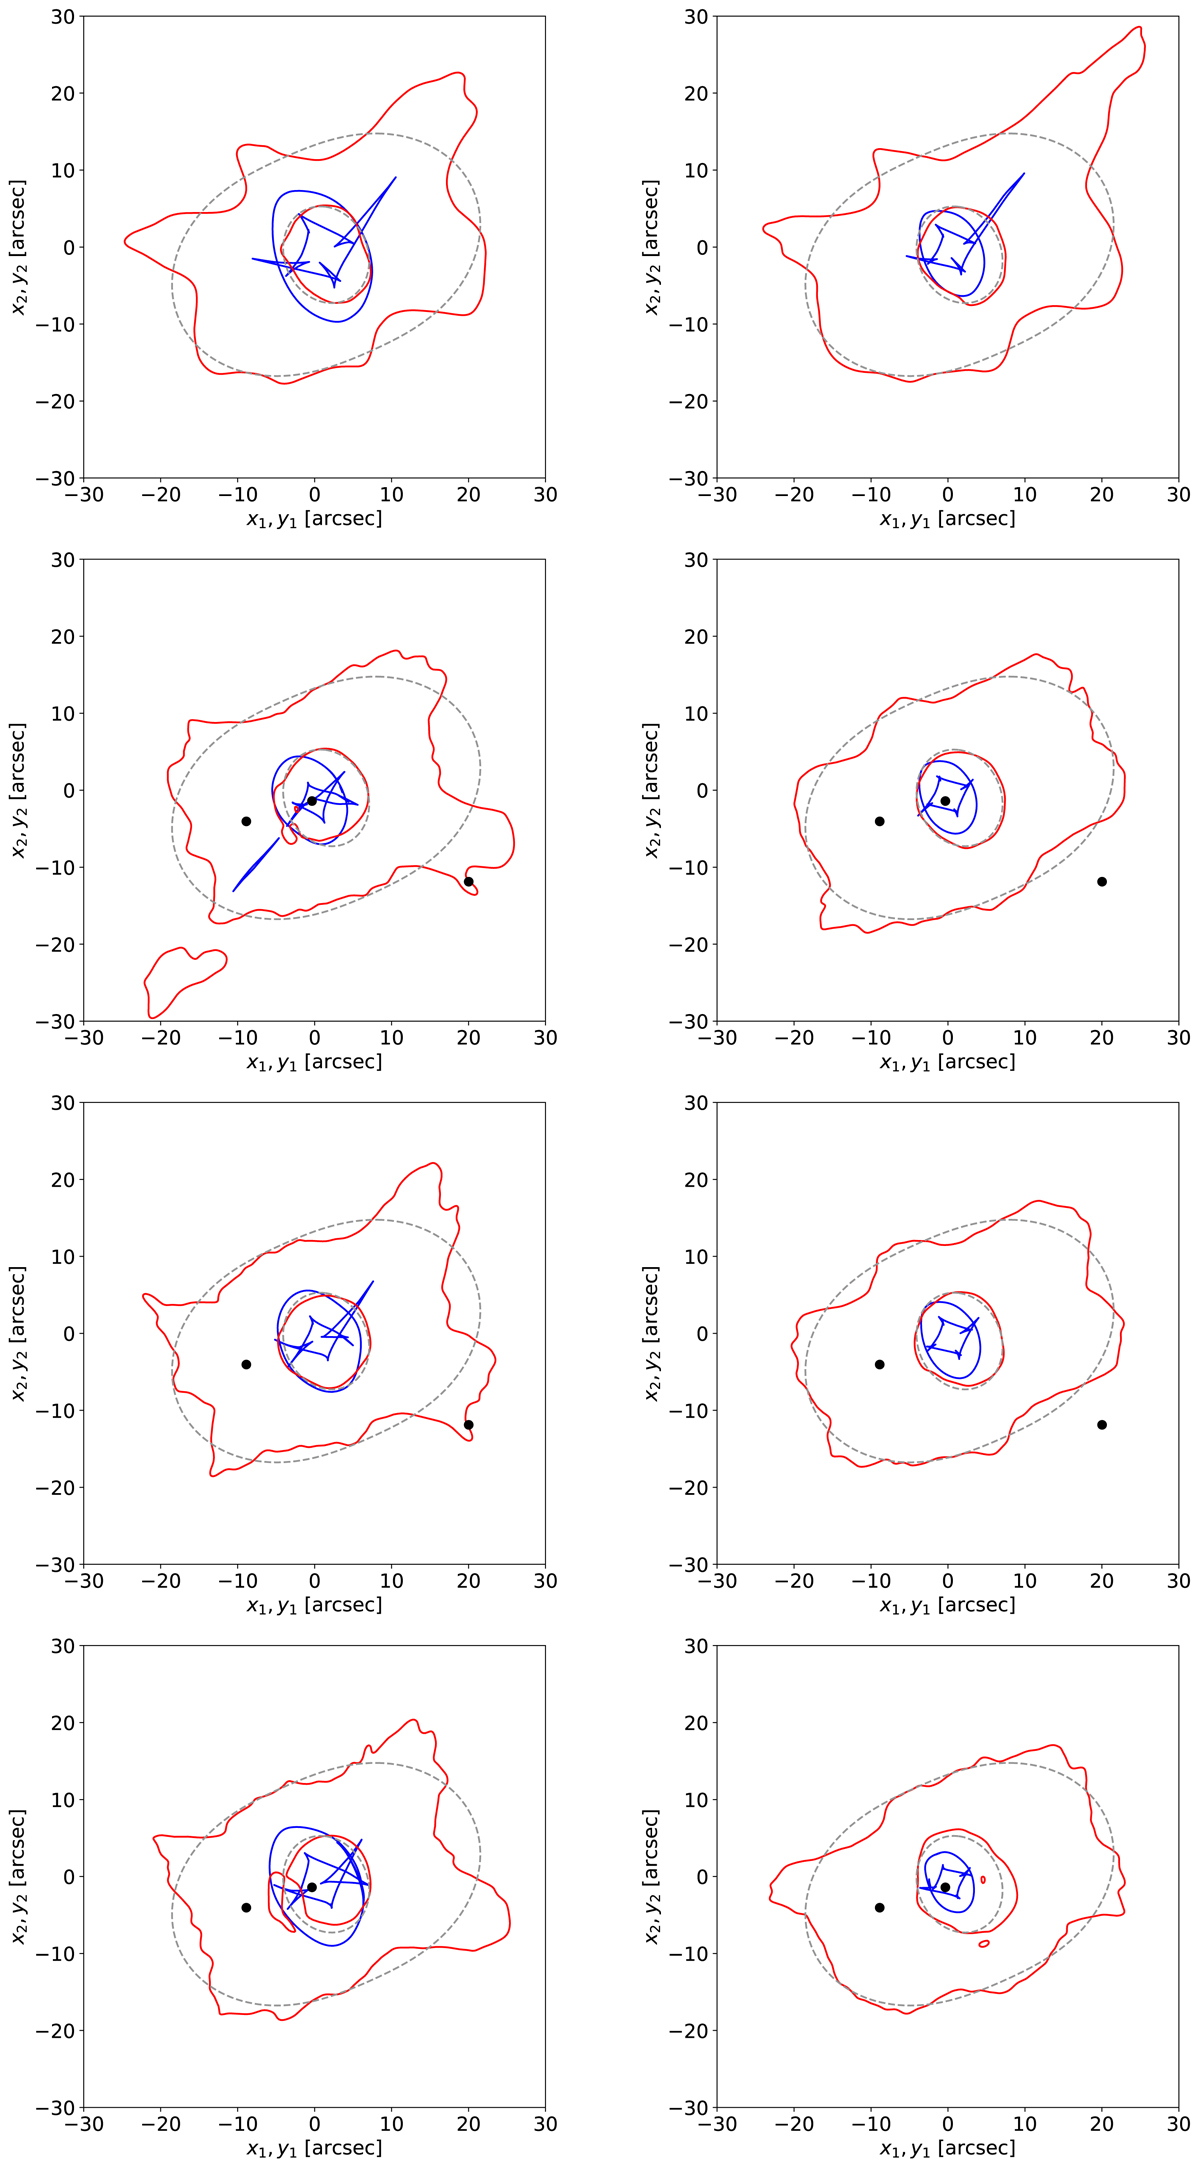
Comparison between Grale lens models for the simulated, generalised NFW profile that is detailed in Liesenborgs & De Rijcke (2012). Each map shows the reconstructed critical curves (red, solid lines) and the reconstructed caustics (blue, solid lines) together with the true critical curves (black, dashed lines) for the Grale models with the same constraints detailed in Table 1 and Fig. 7 (i.e. the left and right columns show models without and including an additional mass-sheet basis function, respectively). Top left panel: model includes no additional mass sheet and no timedelay constraints. Top right panel: using an additional mass sheet. Second row, left: including time-delay constraints between the three multiple images marked by the black dots. Second row, right: as in the left-hand side but using an additional mass sheet. Third row, left: including one time-delay constraint between the multiple images marked by the black dots. Third row, right: as in the left-hand side but with an additional mass sheet. Fourth row, left: same as above but for a different pair of multiple images. Fourth row, right: as for the left-hand side but with an additional mass sheet.
Current usage metrics show cumulative count of Article Views (full-text article views including HTML views, PDF and ePub downloads, according to the available data) and Abstracts Views on Vision4Press platform.
Data correspond to usage on the plateform after 2015. The current usage metrics is available 48-96 hours after online publication and is updated daily on week days.
Initial download of the metrics may take a while.