Fig. 4.
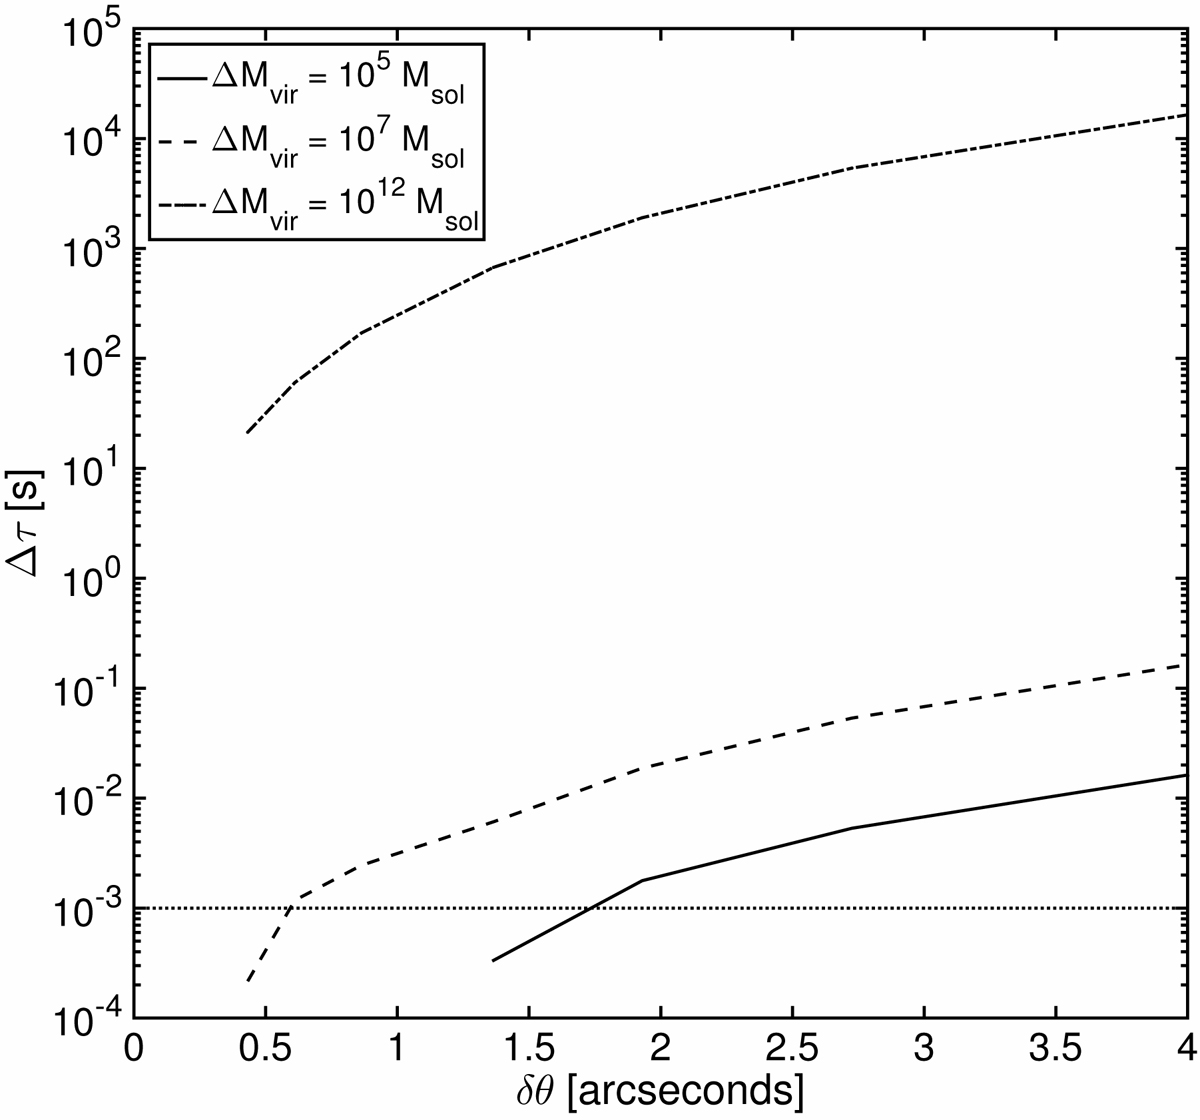
Difference between time delays of repeating multiply imaged FRBs for increasing angular distances at the radial critical curve of the NFW profile of Sect. 2.3 when the virial mass of the NFW profile is increased by 105 solar masses (solid line), by 107 solar masses (dashed line), and by 1012 solar masses (dash-dotted line). The measurement precision of τij for one measurement, approximately 1 ms, is shown as a dotted line.
Current usage metrics show cumulative count of Article Views (full-text article views including HTML views, PDF and ePub downloads, according to the available data) and Abstracts Views on Vision4Press platform.
Data correspond to usage on the plateform after 2015. The current usage metrics is available 48-96 hours after online publication and is updated daily on week days.
Initial download of the metrics may take a while.