Fig. 3.
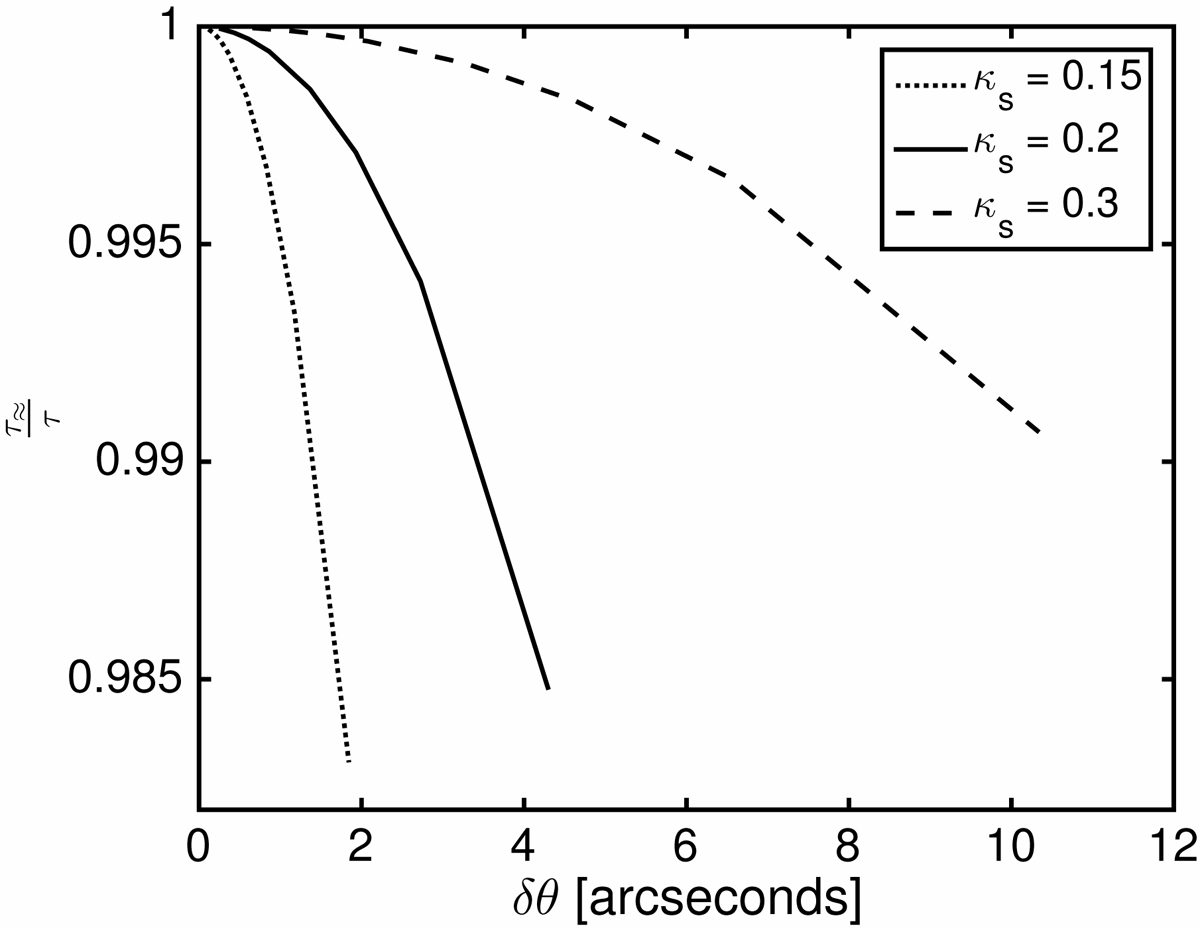
Accuracy of the approximation of the time delay: ratio between τ≈, Eq. (12), and τ, Eq. (11), for the two images straddling the radial critical curve in NFW profiles with rs = 0.5 Mpc for κs = 0.15 (dotted curve), κs = 0.2 (solid curve), and κs = 0.3 (dashed curve) vs. the observed angular separation of the two images δθ = (r1 − r2)rs/Dl.
Current usage metrics show cumulative count of Article Views (full-text article views including HTML views, PDF and ePub downloads, according to the available data) and Abstracts Views on Vision4Press platform.
Data correspond to usage on the plateform after 2015. The current usage metrics is available 48-96 hours after online publication and is updated daily on week days.
Initial download of the metrics may take a while.