Fig. 8.
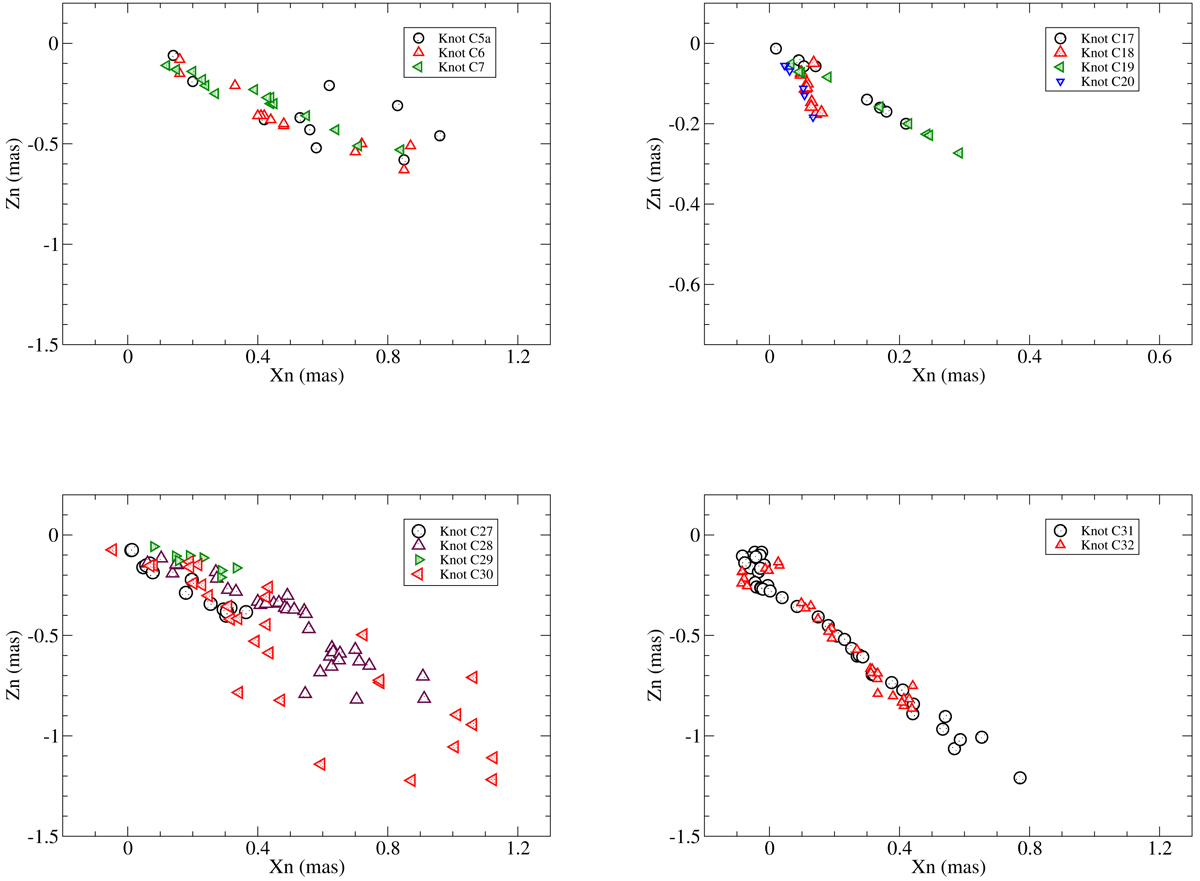
Trajectory distribution of the knots of jet-B, shown in four subsets: (C5a–C7), (C17–C20), (C27–C30), and (C31–C32), revealing some trends of the clustering of their trajectory and ejection direction. The coordinates in the four panels have similar scales for easy inspection of the relative distribution of these trajectories.
Current usage metrics show cumulative count of Article Views (full-text article views including HTML views, PDF and ePub downloads, according to the available data) and Abstracts Views on Vision4Press platform.
Data correspond to usage on the plateform after 2015. The current usage metrics is available 48-96 hours after online publication and is updated daily on week days.
Initial download of the metrics may take a while.