Fig. 7.
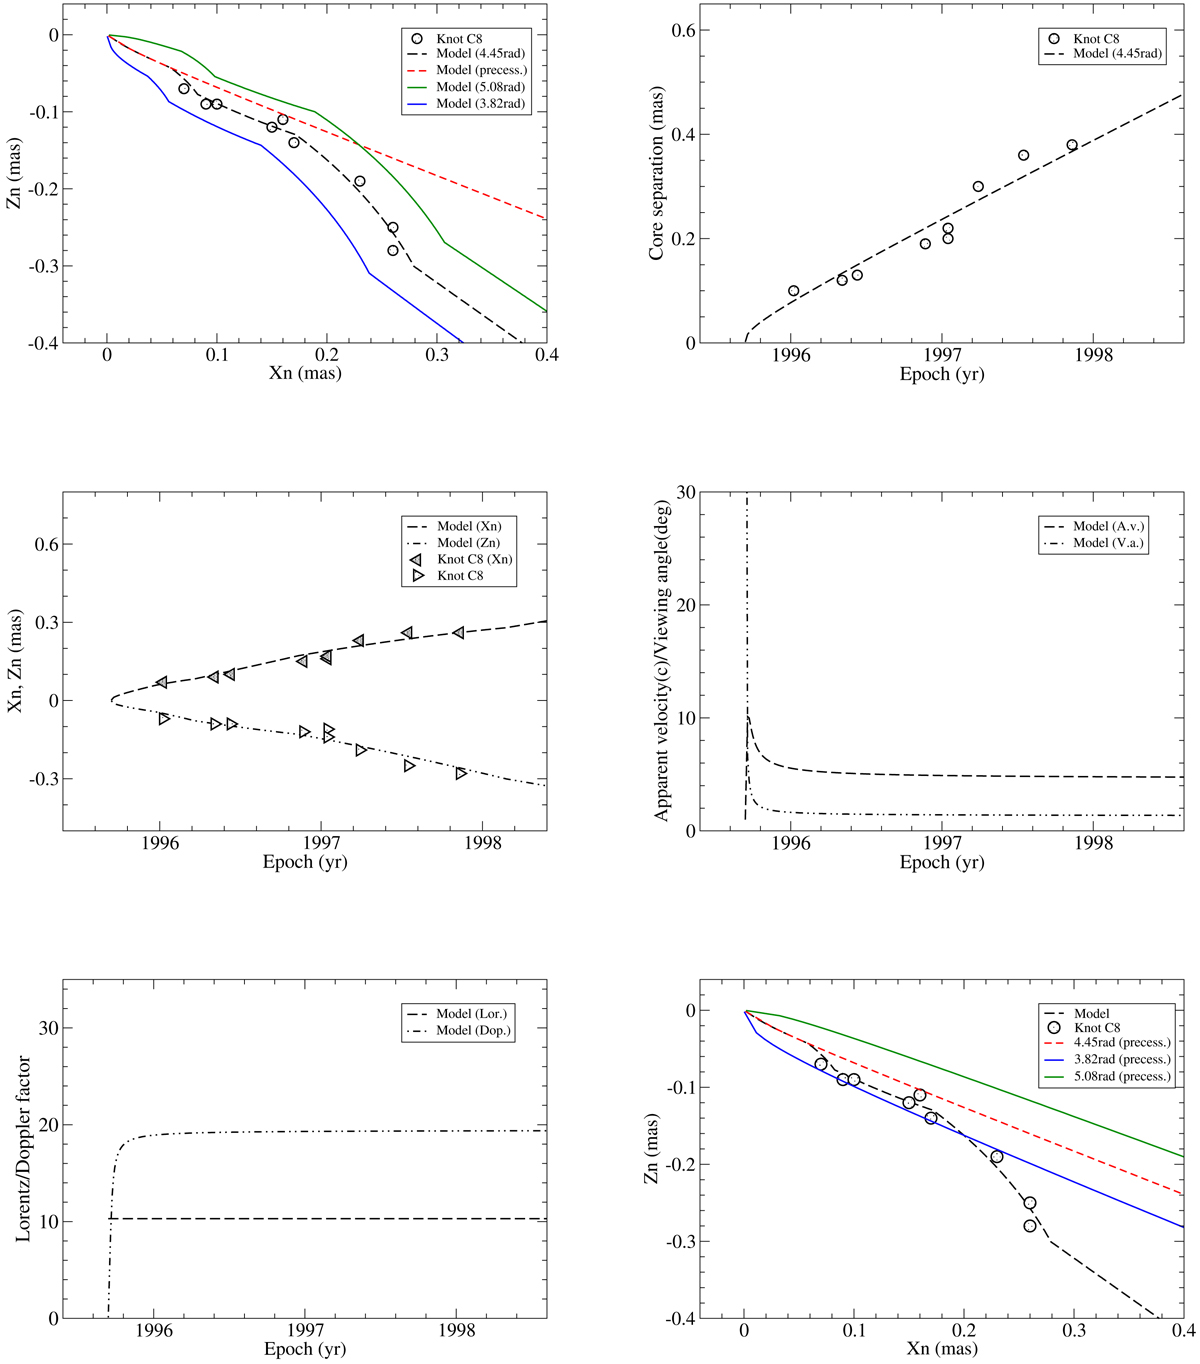
Model-fitting results of the kinematics for knot C8 including trajectory, core separation, coordinates, apparent velocity, viewing angle, Lorentz factor, and Doppler factor. Upper left panel: the green and blue lines represent the fitting model trajectories calculated for precession phases ω ± 0.63 rad. The entire observed trajectory is well fitted (black dashed line) and the observation data points are all within the position angle range defined by the two lines, indicating that the precessing period was determined within an uncertainty of ± 2.5 yr. Bottom right panel: the green and blue lines represent the precessing common parabolic trajectories calculated for precession phases ω ± 0.63 rad and a number of the observation data points are within the position angle range defined by the two lines, indicating that its innermost trajectory following the precessing common trajectory has been observed and knot C8 is marked by symbol “+” in Table 3.
Current usage metrics show cumulative count of Article Views (full-text article views including HTML views, PDF and ePub downloads, according to the available data) and Abstracts Views on Vision4Press platform.
Data correspond to usage on the plateform after 2015. The current usage metrics is available 48-96 hours after online publication and is updated daily on week days.
Initial download of the metrics may take a while.