Fig. 2.
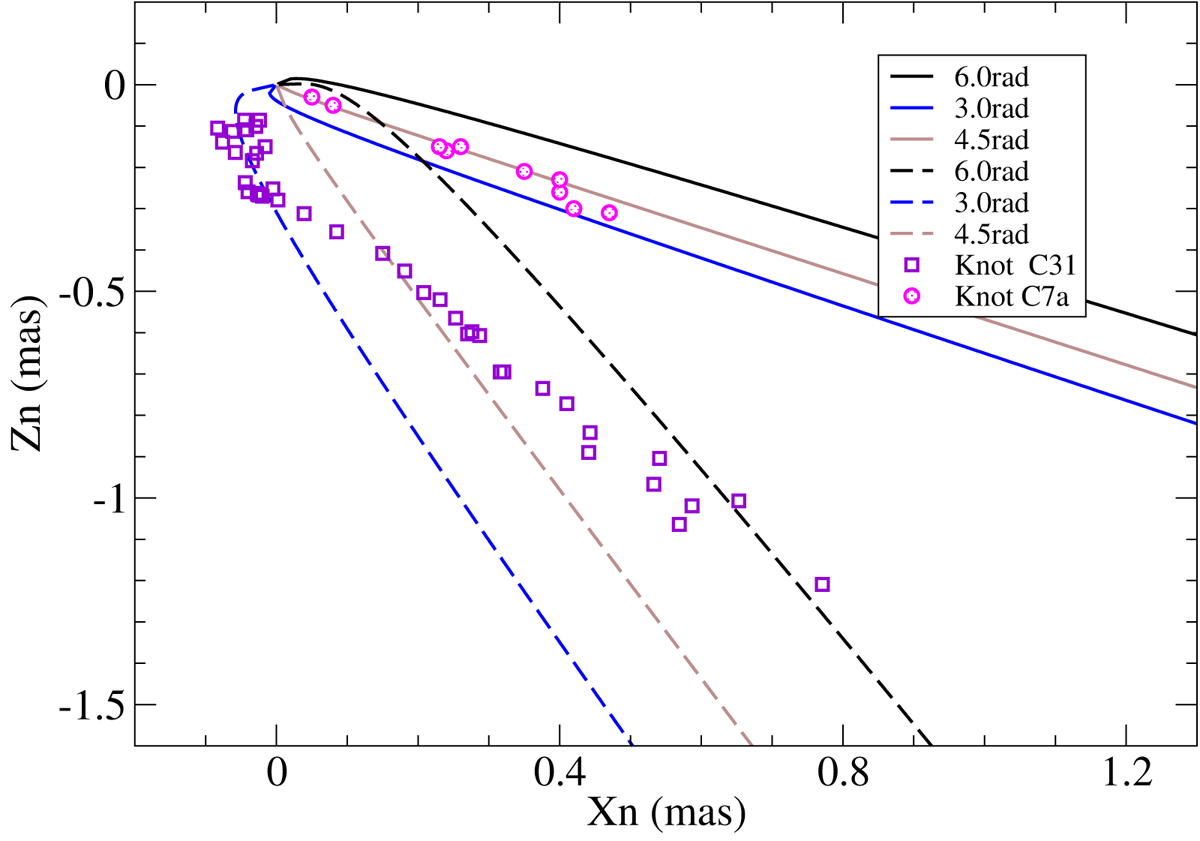
Sketch of the double-jet scenario: the projected cone of the precessing jet-A (northern jet; solid lines) and the projected cone of the precessing jet-B (southern jet; dashed lines). Numbers denote the corresponding precession phases for the trajectories. ω = 6.0 rad and 3.0 rad approximately denote the edges of the cones. Red circles and violet squares are the data points for knots C31 and C7a, respectively.
Current usage metrics show cumulative count of Article Views (full-text article views including HTML views, PDF and ePub downloads, according to the available data) and Abstracts Views on Vision4Press platform.
Data correspond to usage on the plateform after 2015. The current usage metrics is available 48-96 hours after online publication and is updated daily on week days.
Initial download of the metrics may take a while.