Open Access
Fig. 14
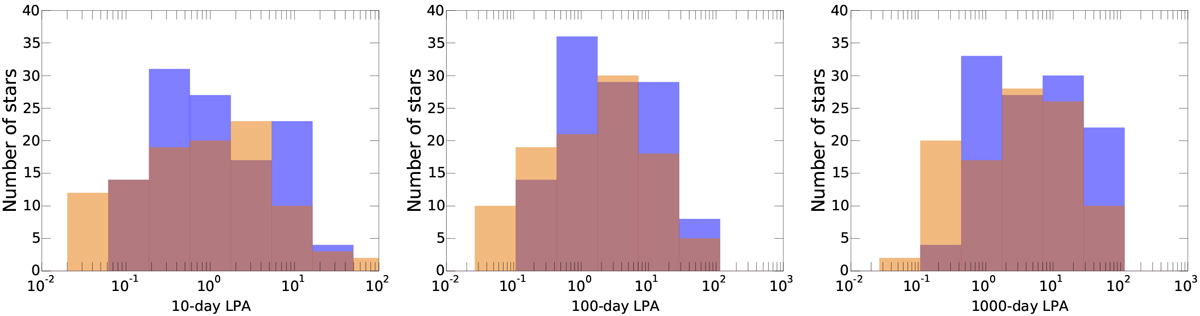
Distribution of the achieved detection limits. From left to right panels: histograms of the 10-day, 102 -day, and 103 -day LPA detection limits. Blue: SOPHIE targets; orange: HARPS targets.
Current usage metrics show cumulative count of Article Views (full-text article views including HTML views, PDF and ePub downloads, according to the available data) and Abstracts Views on Vision4Press platform.
Data correspond to usage on the plateform after 2015. The current usage metrics is available 48-96 hours after online publication and is updated daily on week days.
Initial download of the metrics may take a while.