Fig. 4.
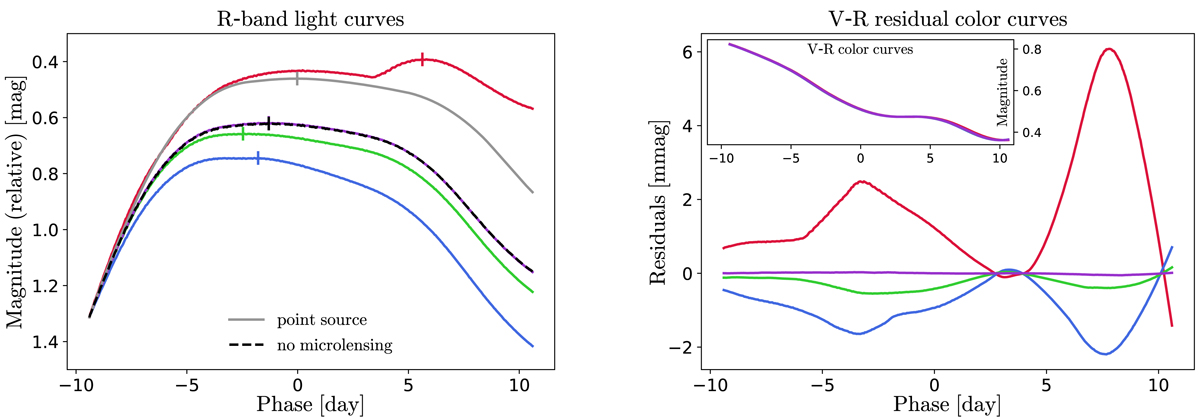
Left panel: toy model light curves for the single image D. The curves have been shifted in magnitude for visual purposes. The vertical ticks mark the observed peak luminosity. The black and purple curves overlap almost perfectly. Right panel: residuals of the microlensed V–R color curves with respect to the nonmicrolensed case. The corresponding position of the source in the microlensing map is indicated by colored circles in the left panel of Fig. 2. The insert shows the V–R color curves prior to the subtraction of the non microlensed color curves. All the curves are displayed in the supernova reference frame, i.e., there is no time rescaling due to the redshift of the supernova.
Current usage metrics show cumulative count of Article Views (full-text article views including HTML views, PDF and ePub downloads, according to the available data) and Abstracts Views on Vision4Press platform.
Data correspond to usage on the plateform after 2015. The current usage metrics is available 48-96 hours after online publication and is updated daily on week days.
Initial download of the metrics may take a while.