Fig. 2.
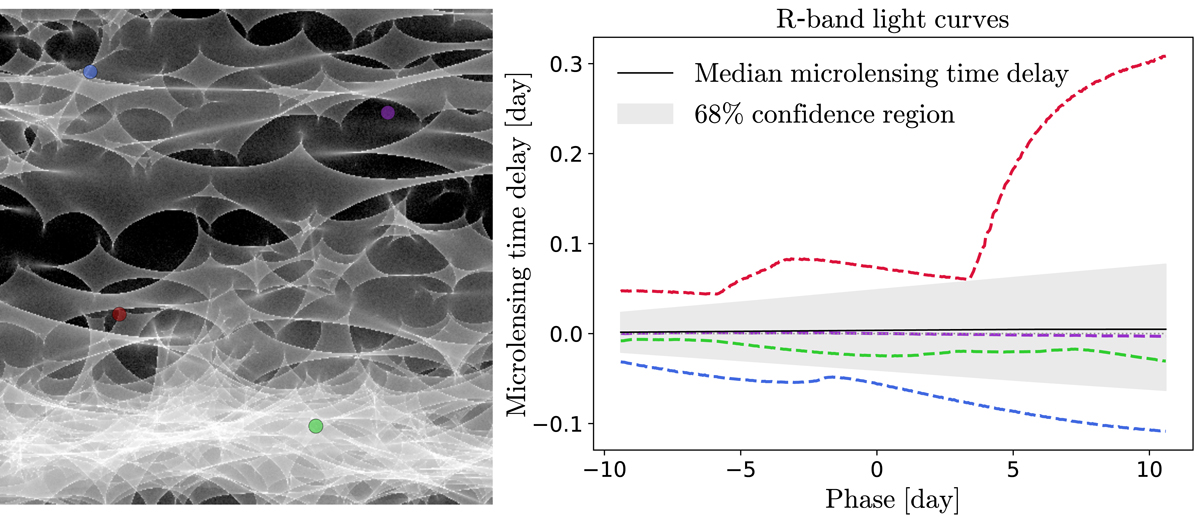
Left panel: zoom-in on the microlensing magnification map for image D of iPTF16geu, with four different source positions indicated with colored disks. The size of the disks correspond to the projected physical size of the supernova 10 days after peak luminosity. White regions in the map correspond to higher magnification. Right panel: evolution of the microlensing time delay over time for the D image of iPTF16geu in our toy model. Phase 0 corresponds to the peak luminosity in R-band of the unlensed point-source template. The solid black line indicates the median delay and the shaded gray envelope covers the 68% confidence region resulting from centering the source on all the possible positions in the magnification map. The colored dashed curves correspond to sources at the location of the colored circles in the left panel. On average, the amplitude of the microlensing time delay is not larger than 0.1 days, but can become much higher in extreme cases.
Current usage metrics show cumulative count of Article Views (full-text article views including HTML views, PDF and ePub downloads, according to the available data) and Abstracts Views on Vision4Press platform.
Data correspond to usage on the plateform after 2015. The current usage metrics is available 48-96 hours after online publication and is updated daily on week days.
Initial download of the metrics may take a while.