Fig. 5.
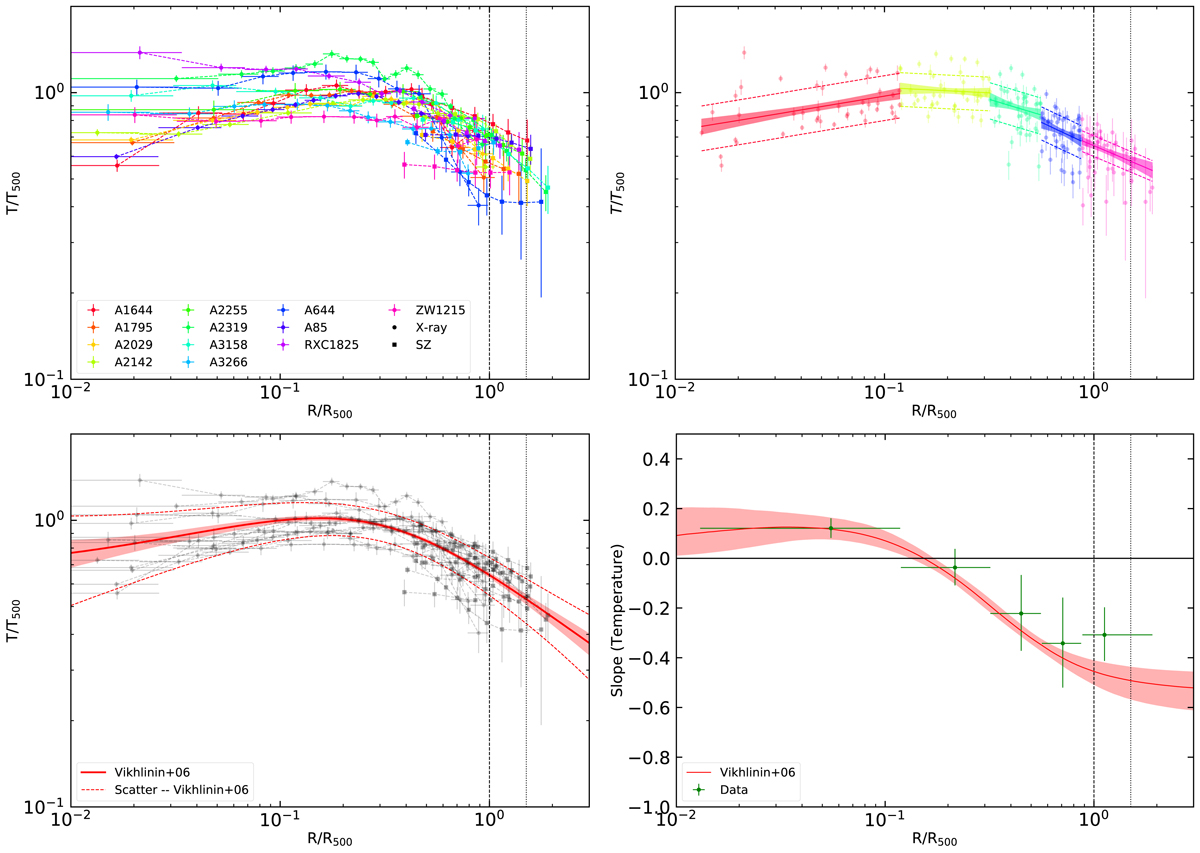
Same as Fig. 3 for the projected temperature profiles rescaled by the self-similar quantity T500 (Eq. (10)). The filled circles show the measurements of the X-ray spectroscopic temperature (see Sect. 2.4.2 ), whereas the filled squares indicate the data points obtained by combining the SZ pressure with the gas density, projected along the line of sight assuming the spectroscopic-like scaling of Mazzotta et al. (2004). The solid red curves in the bottom panels show the best fit to the joint dataset with the functional form introduced by Vikhlinin et al. (2006; see Eq. (11)).
Current usage metrics show cumulative count of Article Views (full-text article views including HTML views, PDF and ePub downloads, according to the available data) and Abstracts Views on Vision4Press platform.
Data correspond to usage on the plateform after 2015. The current usage metrics is available 48-96 hours after online publication and is updated daily on week days.
Initial download of the metrics may take a while.