Fig. 4.
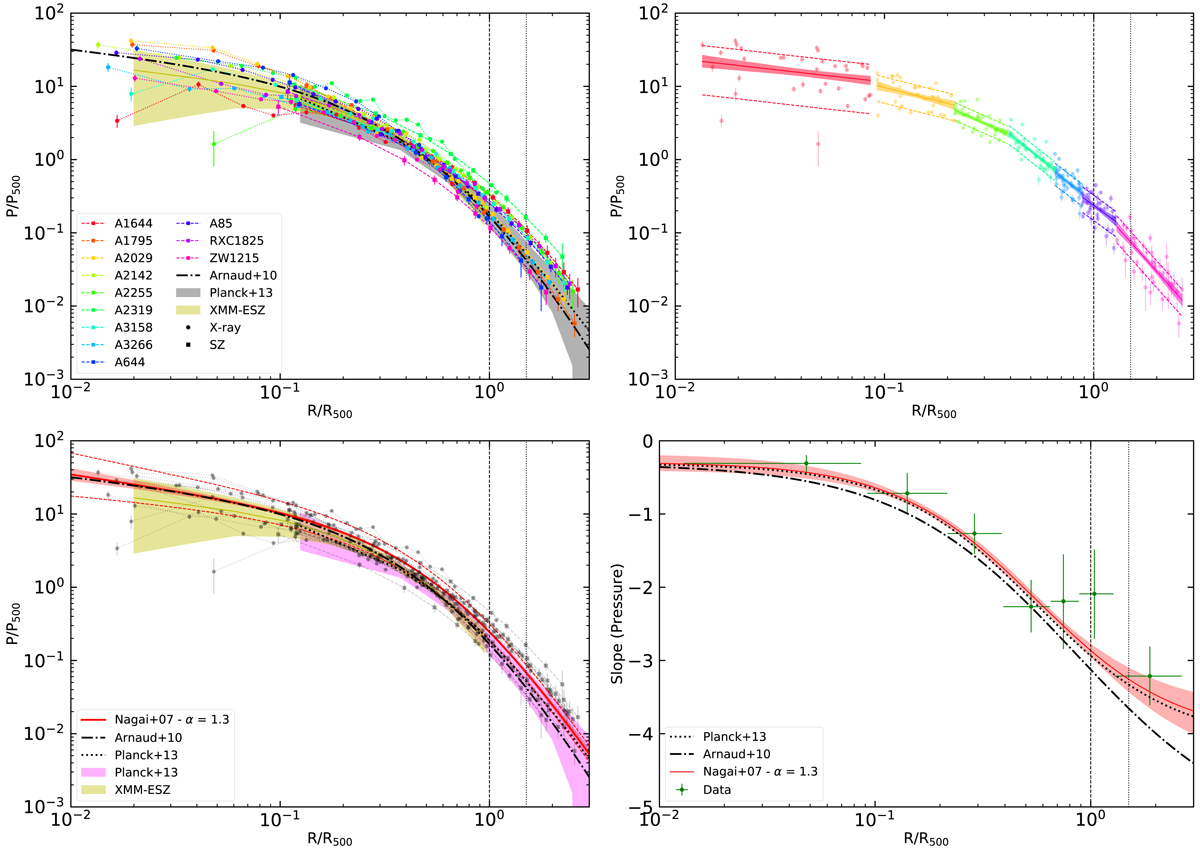
Same as Fig. 3 for the pressure profiles rescaled by the self-similar quantity P500 (Eq. (8)). The squares indicate data points obtained from the deprojection of the SZ signal, while the filled circles are computed by combining the X-ray gas density profiles with the spectroscopic temperature. The solid red curve in the bottom panels shows the joint best fit to the data with the generalized NFW functional form (Nagai et al. 2007, see Eq. (9)). In all these plots the dotted and dashed-dotted lines represent the result of Planck Collaboration Int. V (2013) and Arnaud et al. (2010) respectively. The shadow areas represent the envelope obtained by Planck Collaboration Int. V (2013) and the Early release SZ sample (XMM-ESZ; Planck Collaboration VIII 2011).
Current usage metrics show cumulative count of Article Views (full-text article views including HTML views, PDF and ePub downloads, according to the available data) and Abstracts Views on Vision4Press platform.
Data correspond to usage on the plateform after 2015. The current usage metrics is available 48-96 hours after online publication and is updated daily on week days.
Initial download of the metrics may take a while.