Fig. 3.
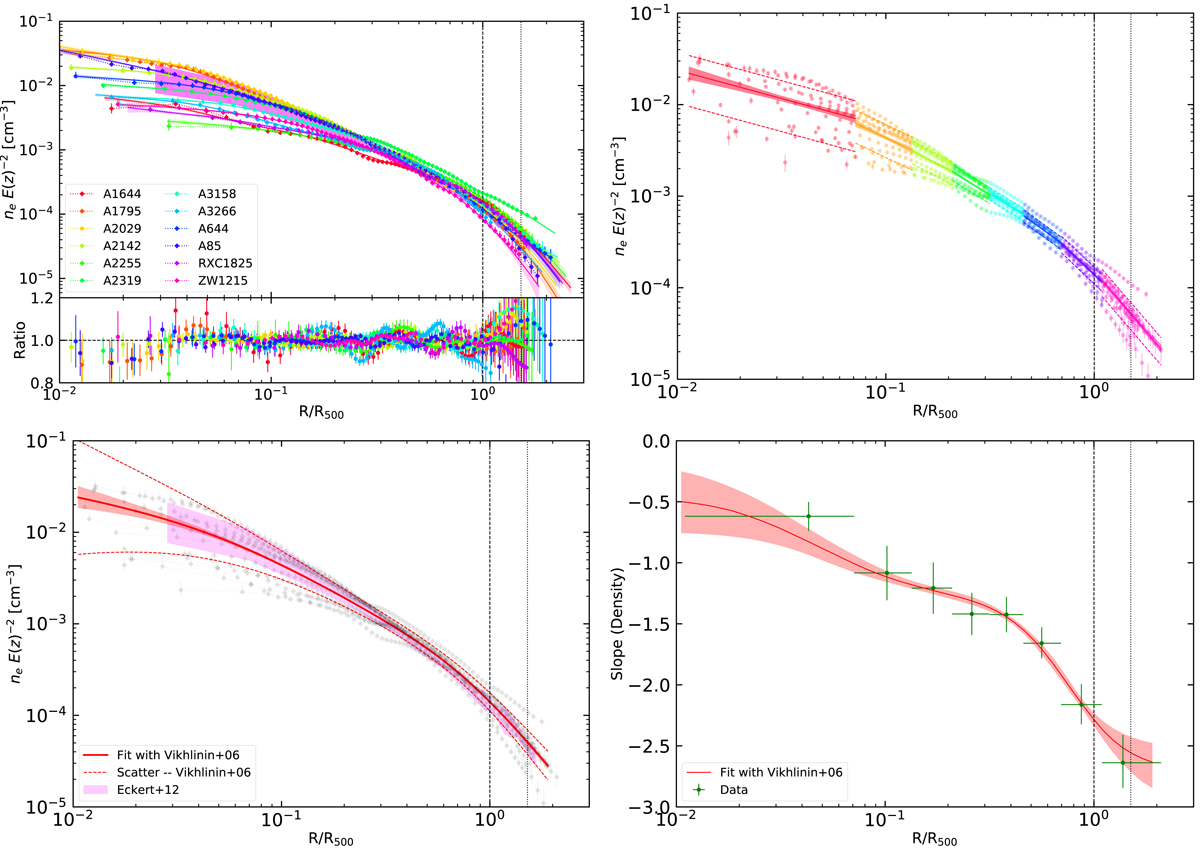
Top left panel: density profiles for all X-COP clusters obtained with two different deprojection methods: L1 regularization (data points) and multiscale fitting (solid lines). The magenta shaded area represents the scatter of the median profile in Eckert et al. (2012). Bottom part: ratio of the two methods for each individual system. Top right panel: joint fit to all the density profiles using piecewise power laws in several radial ranges (color-coded). The best fits and 1σ error envelope are shown by the solid lines, while the dashed lines represent the intrinsic scatter. Bottom left panel: joint fit to the density profiles using the functional form introduced by Vikhlinin et al. (2006), in red, with the shaded area indicating the 1σ error envelope around the best fit. The dashed lines represent the intrinsic scatter in the functional form as a function of radius. Bottom right panel: slope of the density profiles as a function of radius. The green data points show the results of the piecewise power law fits, whereas the red curve indicates the fit to the entire radial range using the Vikhlinin et al. (2006) functional form. In all panels, the vertical dashed and dotted lines represent the location of R500 and R200, respectively.
Current usage metrics show cumulative count of Article Views (full-text article views including HTML views, PDF and ePub downloads, according to the available data) and Abstracts Views on Vision4Press platform.
Data correspond to usage on the plateform after 2015. The current usage metrics is available 48-96 hours after online publication and is updated daily on week days.
Initial download of the metrics may take a while.