Fig. 2.
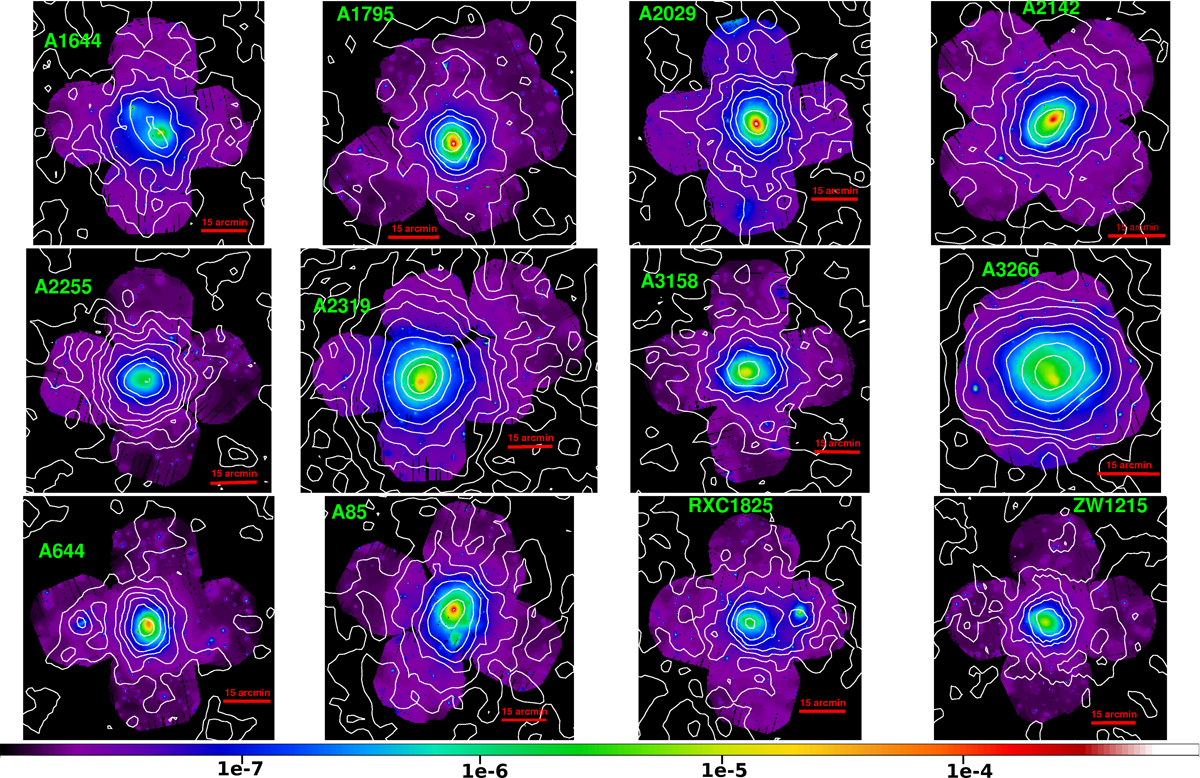
Adaptively smoothed and exposure corrected XMM-Newton mosaic images in the [0.7–1.2] keV energy band for all X-COP clusters. The superimposed white contours represent the Planck SZ S/N maps between 70 and 857 GHz. The contour levels correspond to 1, 3, 5, 7, 10, 15, 20, 30, 40, and 50σ. The spatial scale is given by the red thick lines, which have a common length of 15 arcmin. The color scale is given below the images in units of cts s−1 pixel−1, and is the same for all clusters.
Current usage metrics show cumulative count of Article Views (full-text article views including HTML views, PDF and ePub downloads, according to the available data) and Abstracts Views on Vision4Press platform.
Data correspond to usage on the plateform after 2015. The current usage metrics is available 48-96 hours after online publication and is updated daily on week days.
Initial download of the metrics may take a while.