Fig. B.1.
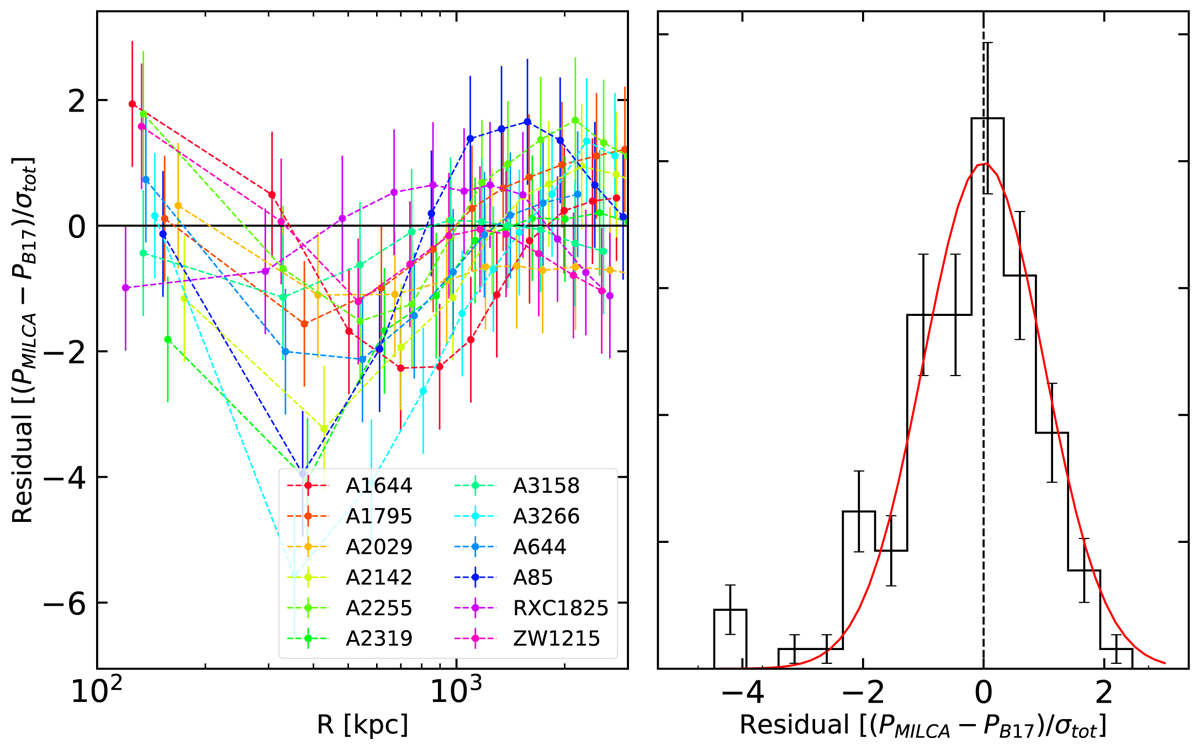
Left panel: residuals of the comparison of the two different methods we used to estimate the SZ pressure profile. A remarkable good agreement within the statistical uncertainties is reached at all radii, especially excluding the first 3 MILCA points which are the most affected by the Planck PSF. Right panel: distribution of the residuals compared with the statistical prediction of a set of residuals: a Gaussian centered in zero and width one (red line).
Current usage metrics show cumulative count of Article Views (full-text article views including HTML views, PDF and ePub downloads, according to the available data) and Abstracts Views on Vision4Press platform.
Data correspond to usage on the plateform after 2015. The current usage metrics is available 48-96 hours after online publication and is updated daily on week days.
Initial download of the metrics may take a while.