Free Access
Fig. 1.
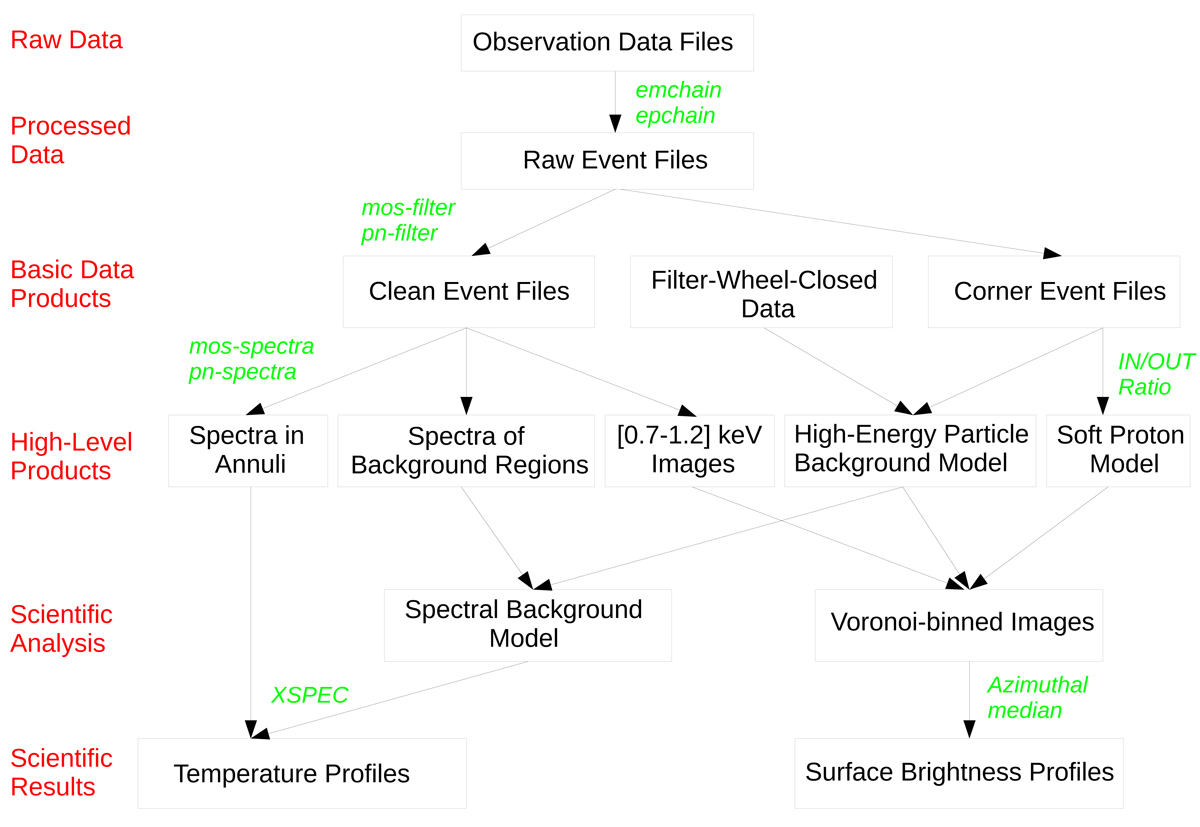
Flow chart of the XMM-Newton data analysis pipeline. The steps of the analysis are shown in red, the main intermediate and final products are described in the black boxes, and the procedures are shown in green italics.
Current usage metrics show cumulative count of Article Views (full-text article views including HTML views, PDF and ePub downloads, according to the available data) and Abstracts Views on Vision4Press platform.
Data correspond to usage on the plateform after 2015. The current usage metrics is available 48-96 hours after online publication and is updated daily on week days.
Initial download of the metrics may take a while.