Free Access
Fig. 7.
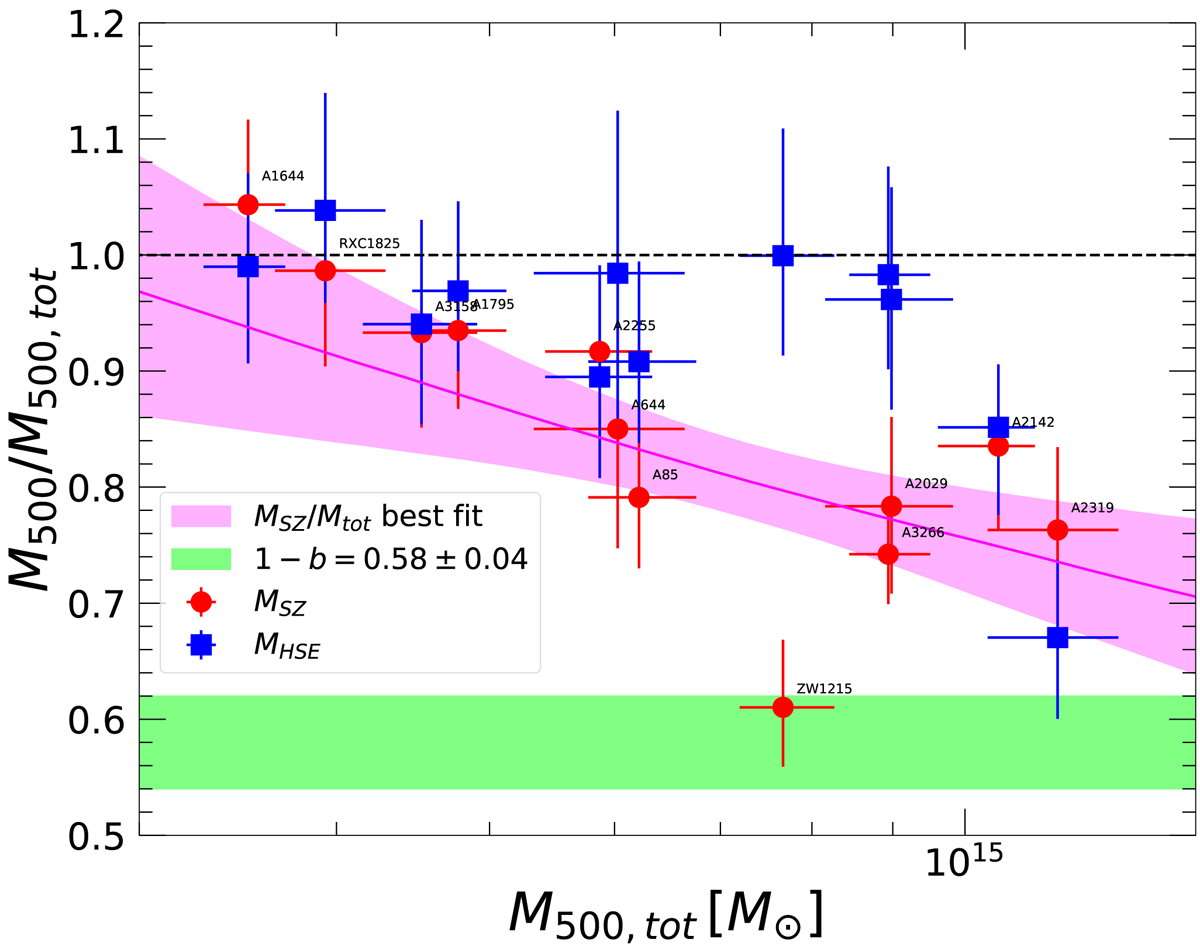
Comparison between HSE (blue squares)/SZ (red dots) and total masses corrected for non-thermal pressure as a function of mass. The magenta line and shaded area show our best fit to the SZ data with a power law, whereas the green area displays the expectation for a constant mass bias 1 − b = 0.58 ± 0.04.
Current usage metrics show cumulative count of Article Views (full-text article views including HTML views, PDF and ePub downloads, according to the available data) and Abstracts Views on Vision4Press platform.
Data correspond to usage on the plateform after 2015. The current usage metrics is available 48-96 hours after online publication and is updated daily on week days.
Initial download of the metrics may take a while.