Fig. 6.
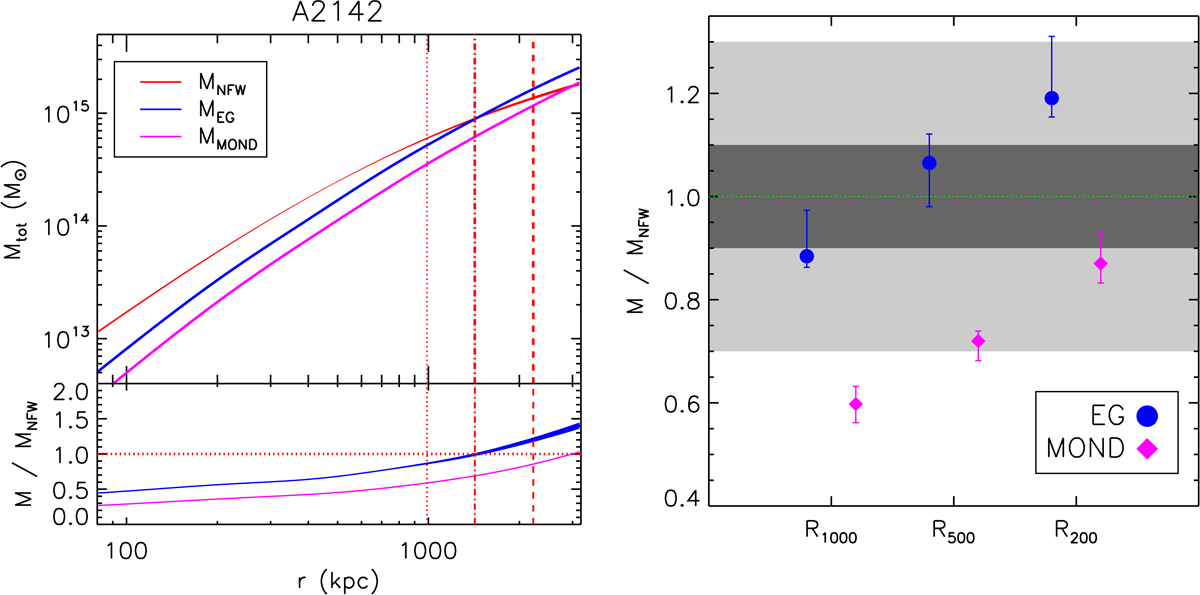
Left panel: typical hydrostatic, EG and MOND radial mass profiles (here for A2142; plots for the remaining 12 objects in Appendix B. Vertical lines indicate R1000 (dotted line), R500 (dash-dotted line) and R200 (dashed line). Right panel: medians (and 1st and 3rd quartiles) of the ratio between the hydrostatic mass and the value predicted from EG and MOND for the whole X-COP sample. Shaded regions indicate the < 10% (darkest) and < 30% differences.
Current usage metrics show cumulative count of Article Views (full-text article views including HTML views, PDF and ePub downloads, according to the available data) and Abstracts Views on Vision4Press platform.
Data correspond to usage on the plateform after 2015. The current usage metrics is available 48-96 hours after online publication and is updated daily on week days.
Initial download of the metrics may take a while.