Fig. 4.
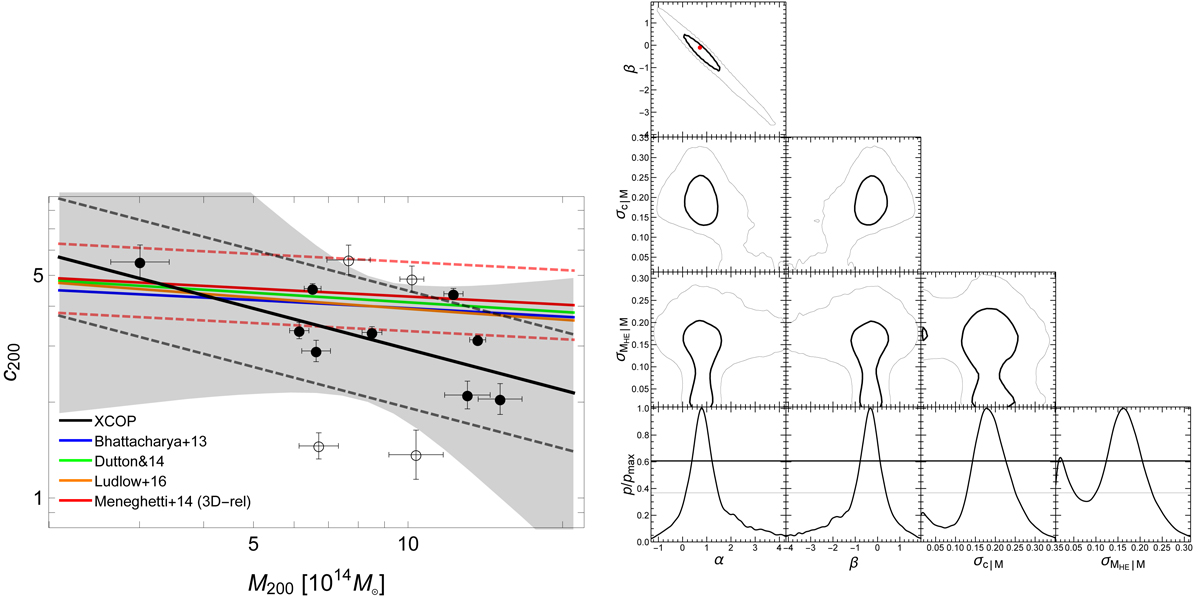
Left panel: concentration–mass relation of the X-COP clusters. The dashed black lines show the median scaling relation (full black line) plus or minus the intrinsic scatter at redshift z = 0.06. The shaded grey region encloses the 68.3% confidence region around the median relation due to uncertainties on the scaling parameters. As reference, we plot the concentration–mass relations of Bhattacharya et al. (2013, blue line), Dutton & Macciò (2014, green line), Ludlow et al. (2016, orange line), and Meneghetti et al. (2014, solid and dashed red lines). The dashed red lines enclose the 1-σ scatter region in the theoretical concentration–mass relation from the MUSIC-2 N-body/hydrodynamical simulations. Empty circles identify the four objects (A644, A1644, A2255, A2319; see Fig. 2) for which NFW does not represent the best-fit mass model. Right panel: probability distributions of the parameters of the concentration–mass relation. The thick and thin black contours include the 1-σ and 2-σ confidence regions in two dimensions, here defined as the regions within which the probability is larger than exp(−2.3/2) and exp(−6.17/2) of the maximum, respectively. The red disk represents the parameters found by Meneghetti et al. (2014) for the relaxed sample. The bottom row plots the marginalized 1D distributions, renormalized to the maximum probability. The thick and thin black levels denote the confidence limits in one dimension, i.e. exp(−1/2) and exp(−4/2) of the maximum.
Current usage metrics show cumulative count of Article Views (full-text article views including HTML views, PDF and ePub downloads, according to the available data) and Abstracts Views on Vision4Press platform.
Data correspond to usage on the plateform after 2015. The current usage metrics is available 48-96 hours after online publication and is updated daily on week days.
Initial download of the metrics may take a while.