Free Access
Fig. 2.
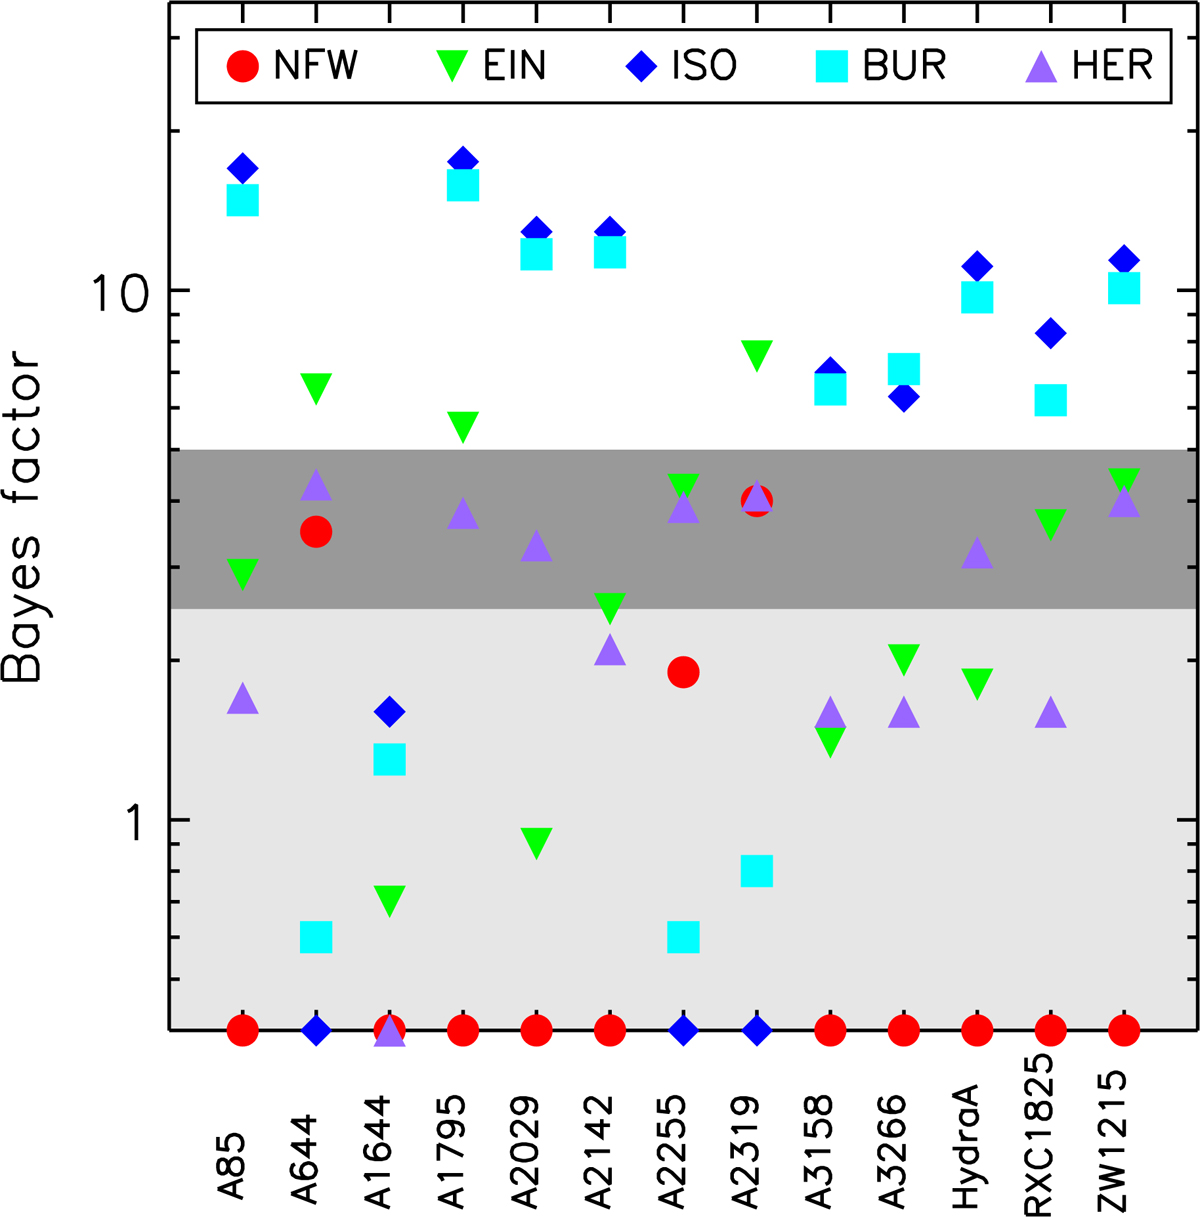
Bayes factor of the mass models investigated with respect to the one with the highest evidence (see Table A.1). Shaded regions identify values of the Bayes factor where the tension between the models is either weak (< 2.5) or strong (> 5) according to the Jeffreys scale (Jeffreys 1961).
Current usage metrics show cumulative count of Article Views (full-text article views including HTML views, PDF and ePub downloads, according to the available data) and Abstracts Views on Vision4Press platform.
Data correspond to usage on the plateform after 2015. The current usage metrics is available 48-96 hours after online publication and is updated daily on week days.
Initial download of the metrics may take a while.