Free Access
Fig. 8.
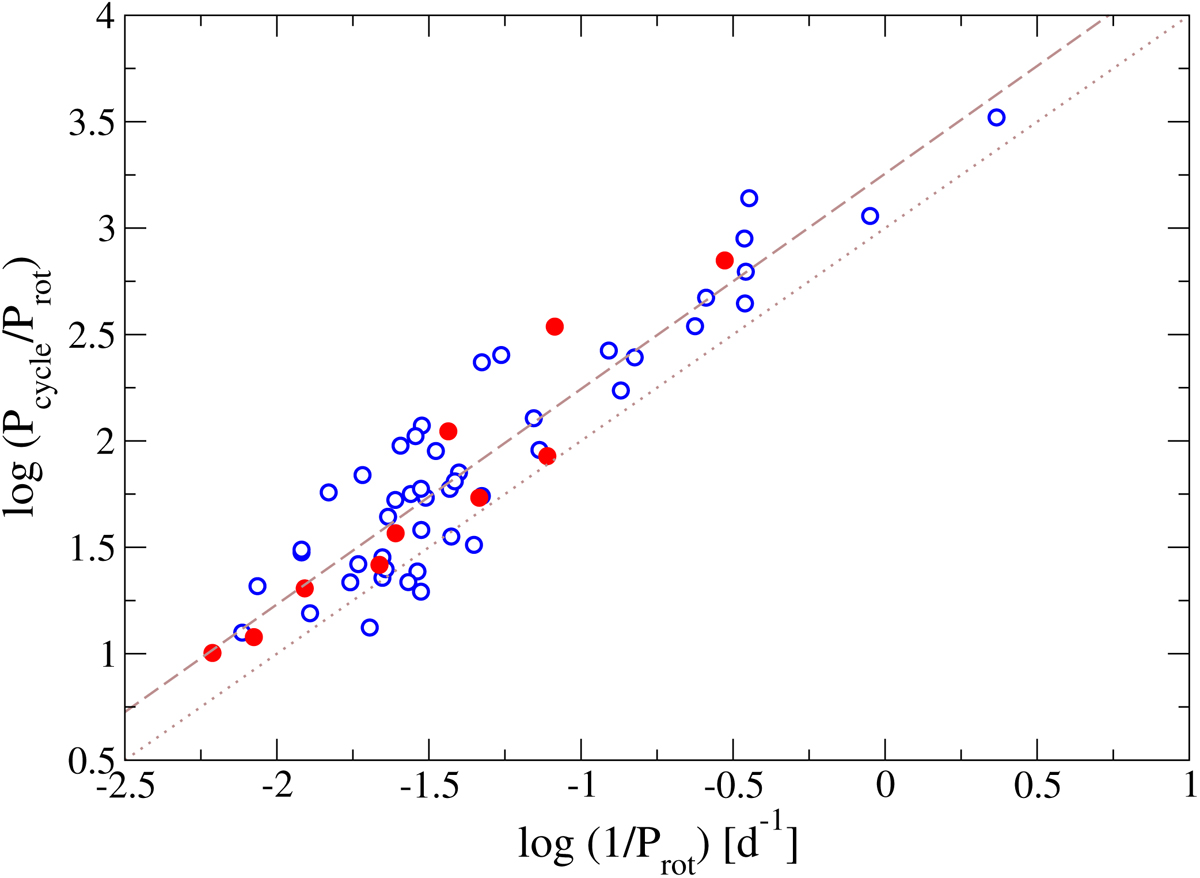
Pcycle/Prot vs. 1/Prot in log–log scale for M dwarf stars with previous published Pcycle and Prot (blue open circles) and stars with new Pcycle from this work (red filled circles). Dashed (i = 1.01) and dotted (i = 1.00, with arbitrary offset) lines mark our sample fit and non-correlation, respectively.
Current usage metrics show cumulative count of Article Views (full-text article views including HTML views, PDF and ePub downloads, according to the available data) and Abstracts Views on Vision4Press platform.
Data correspond to usage on the plateform after 2015. The current usage metrics is available 48-96 hours after online publication and is updated daily on week days.
Initial download of the metrics may take a while.