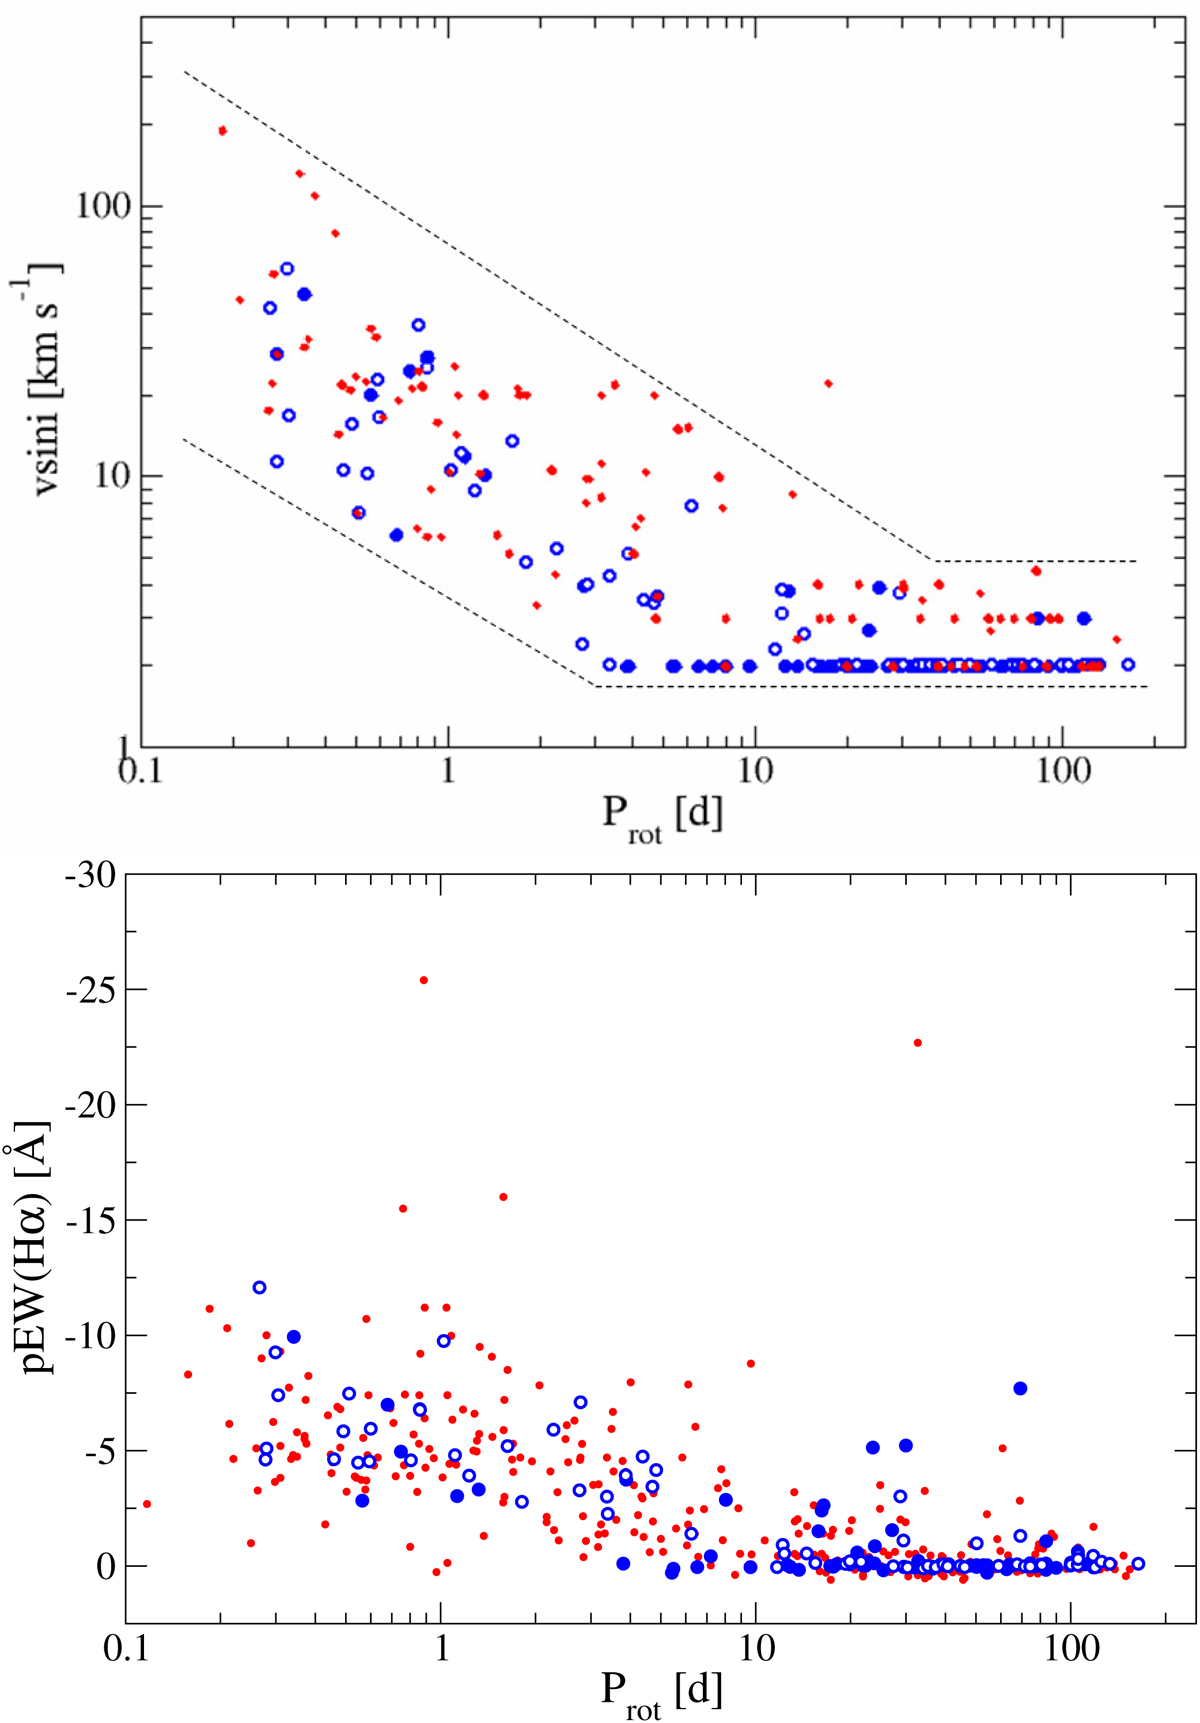
Fig. 4.

v sini vs. Prot (top panel) and pEW(Hα) vs. Prot (bottom panel) for stars with new (blue filled circles) and re-computed rotation periods in this study (blue open circles) and stars in Carmencita with previously published rotation periods (red dots). In the top panel, the dotted lines indicate the lower and upper envelopes of the v sini − Prot relation, and most of the values at v sini = 2 or 3 km s−1 are upper limits. Compare with Figs. 6 and 8 in Jeffers et al. (2018). Here we present 154 new or improved v sini − Prot and pEW(Hα)–Prot pairs, with periods from this work and velocities and Hα equivalent widths from Reiners et al. (2018b). Outlier stars in both panels are discussed in the text.
Current usage metrics show cumulative count of Article Views (full-text article views including HTML views, PDF and ePub downloads, according to the available data) and Abstracts Views on Vision4Press platform.
Data correspond to usage on the plateform after 2015. The current usage metrics is available 48-96 hours after online publication and is updated daily on week days.
Initial download of the metrics may take a while.


