Fig. 6.
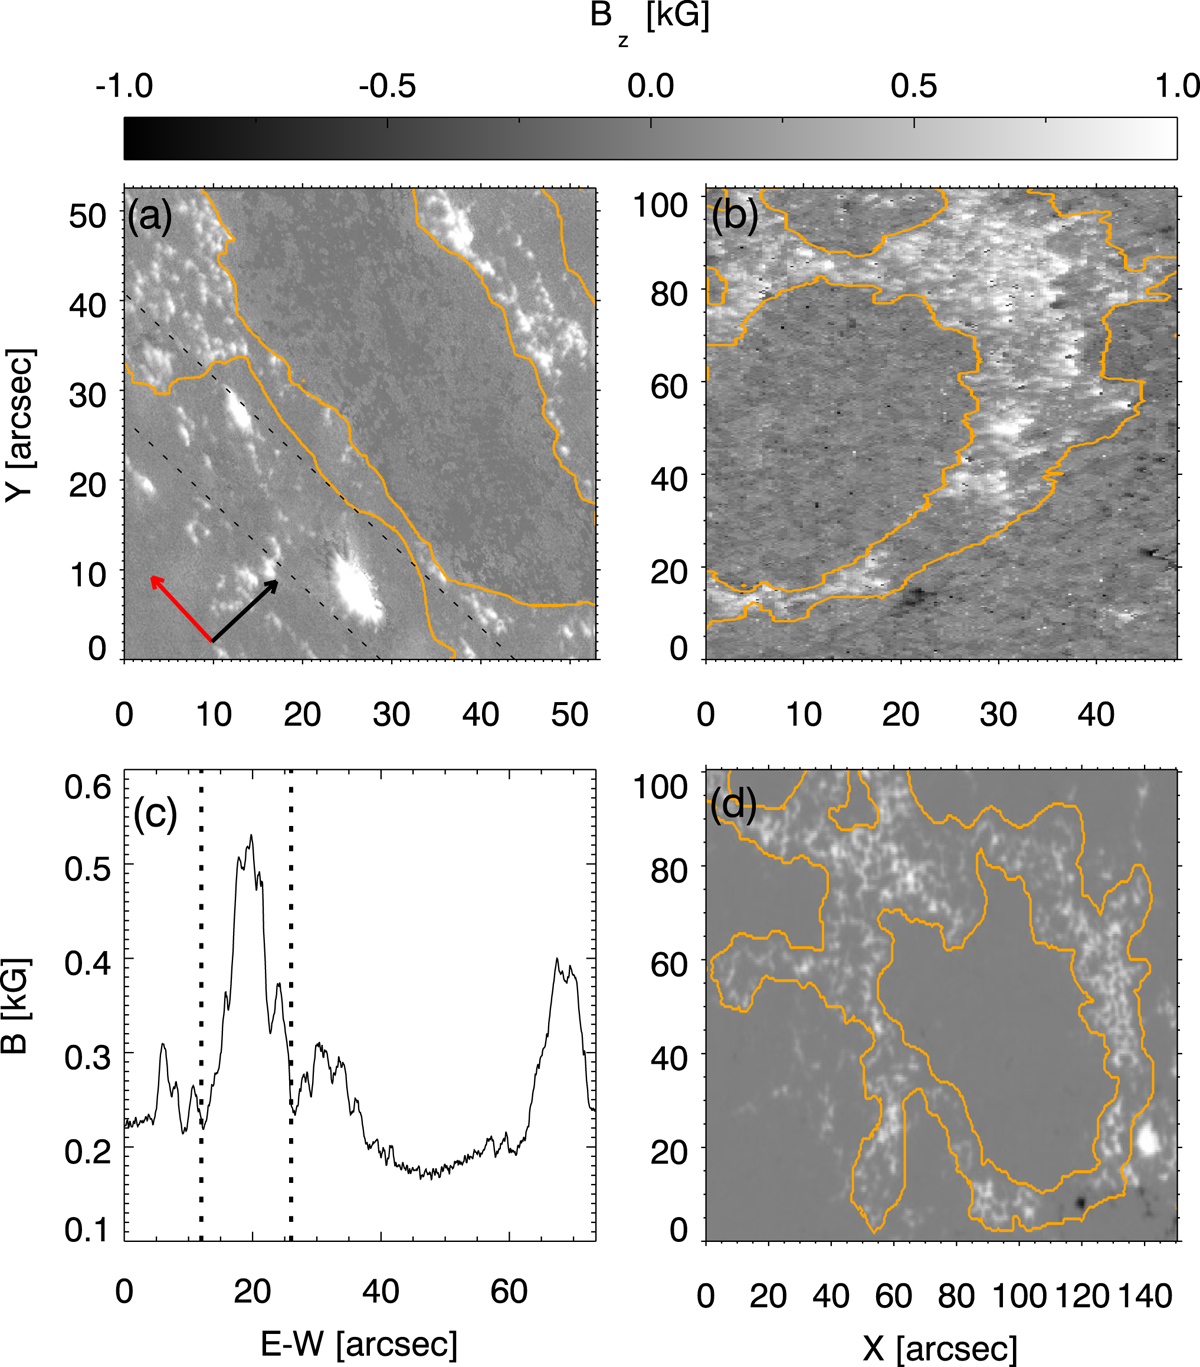
Vertical magnetic field map obtained with CRISP (panel a), Hinode/SP (panel b), and SDO/HMI (panel d). The red arrow indicates the north and the black arrow the E-W direction. In panels b and d, the north coincides with the top side of the image. The orange contour indicates the masks employed for the flux calculation. Panel c: average magnetic field strength along the E-W direction calculated from the CRISP data. The dotted lines in panels a and c highlight the region containing the pores.
Current usage metrics show cumulative count of Article Views (full-text article views including HTML views, PDF and ePub downloads, according to the available data) and Abstracts Views on Vision4Press platform.
Data correspond to usage on the plateform after 2015. The current usage metrics is available 48-96 hours after online publication and is updated daily on week days.
Initial download of the metrics may take a while.