Fig. 2.
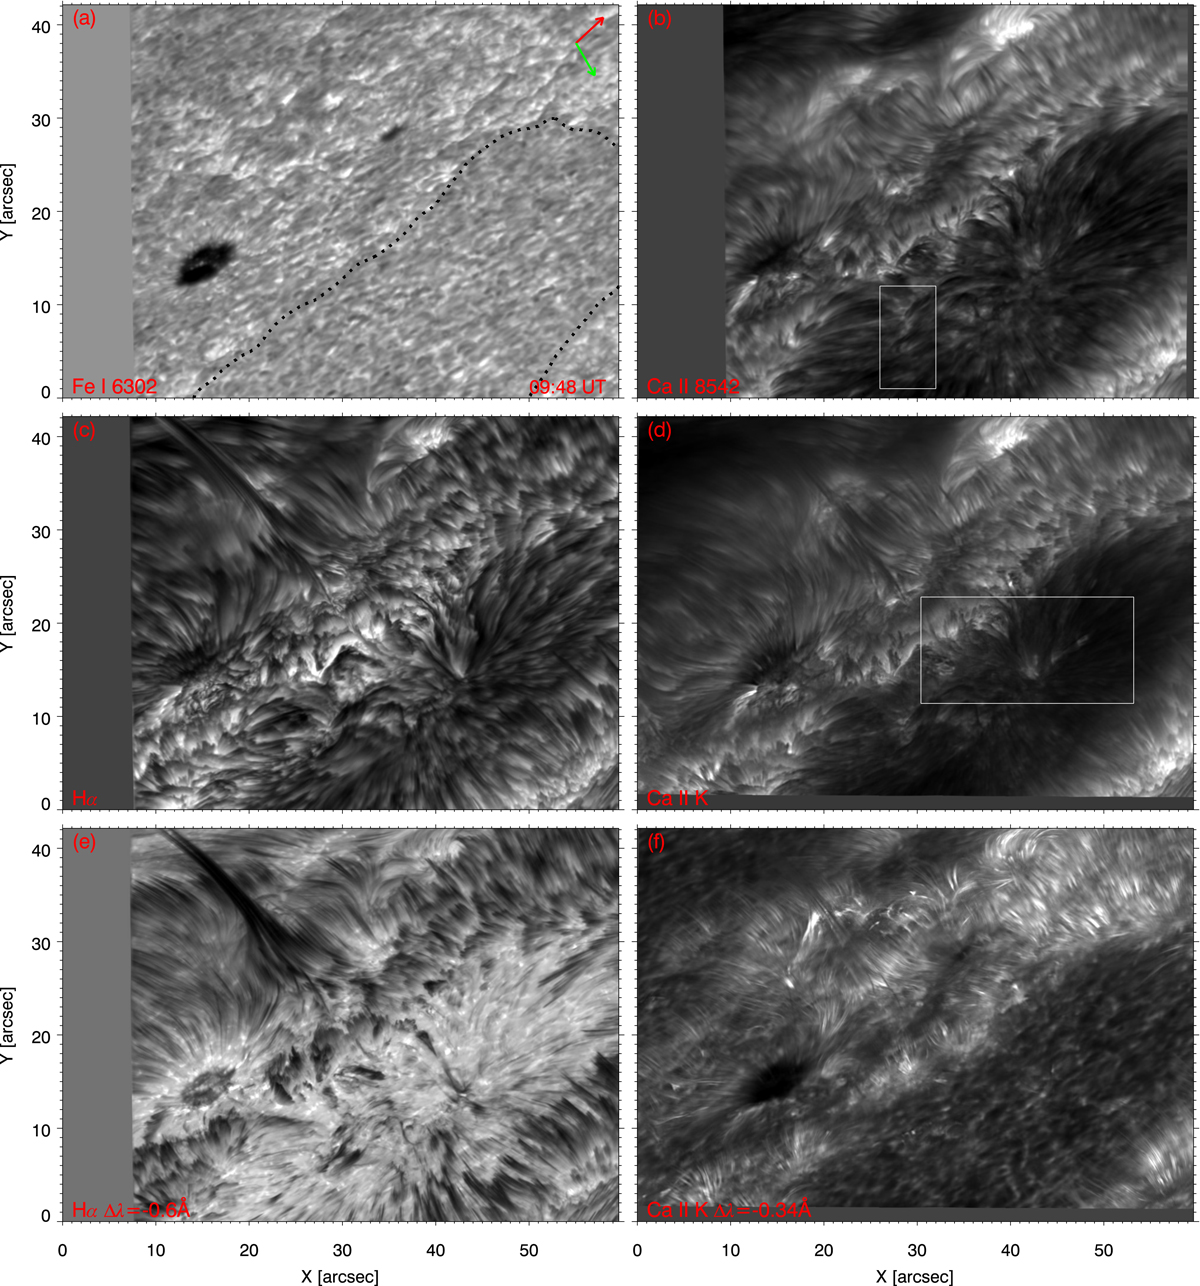
Nominal line core intensity map of Fe I 6302 Å (panel a), Ca II 8542 Å (panel b), Hα (panel c), and Ca II K (panel d) and blue wings intensity of Hα (panel e) and Ca II K (panel f) at Δλ = −0.6 Å and Δλ = −0.34 Å, respectively. The images are spatially and temporally co-aligned according to the CHROMIS field of view. The black dotted curve identifies the bright network. The white rectangle in panel b corresponds to the one shown in Fig. 3b while the rectangle in panel d highlights the region shown by Fig. 9. The red arrow indicates the north and the green arrow the disk centre. The temporal evolution is shown in a movie in the online edition.
Current usage metrics show cumulative count of Article Views (full-text article views including HTML views, PDF and ePub downloads, according to the available data) and Abstracts Views on Vision4Press platform.
Data correspond to usage on the plateform after 2015. The current usage metrics is available 48-96 hours after online publication and is updated daily on week days.
Initial download of the metrics may take a while.