Fig. 11.
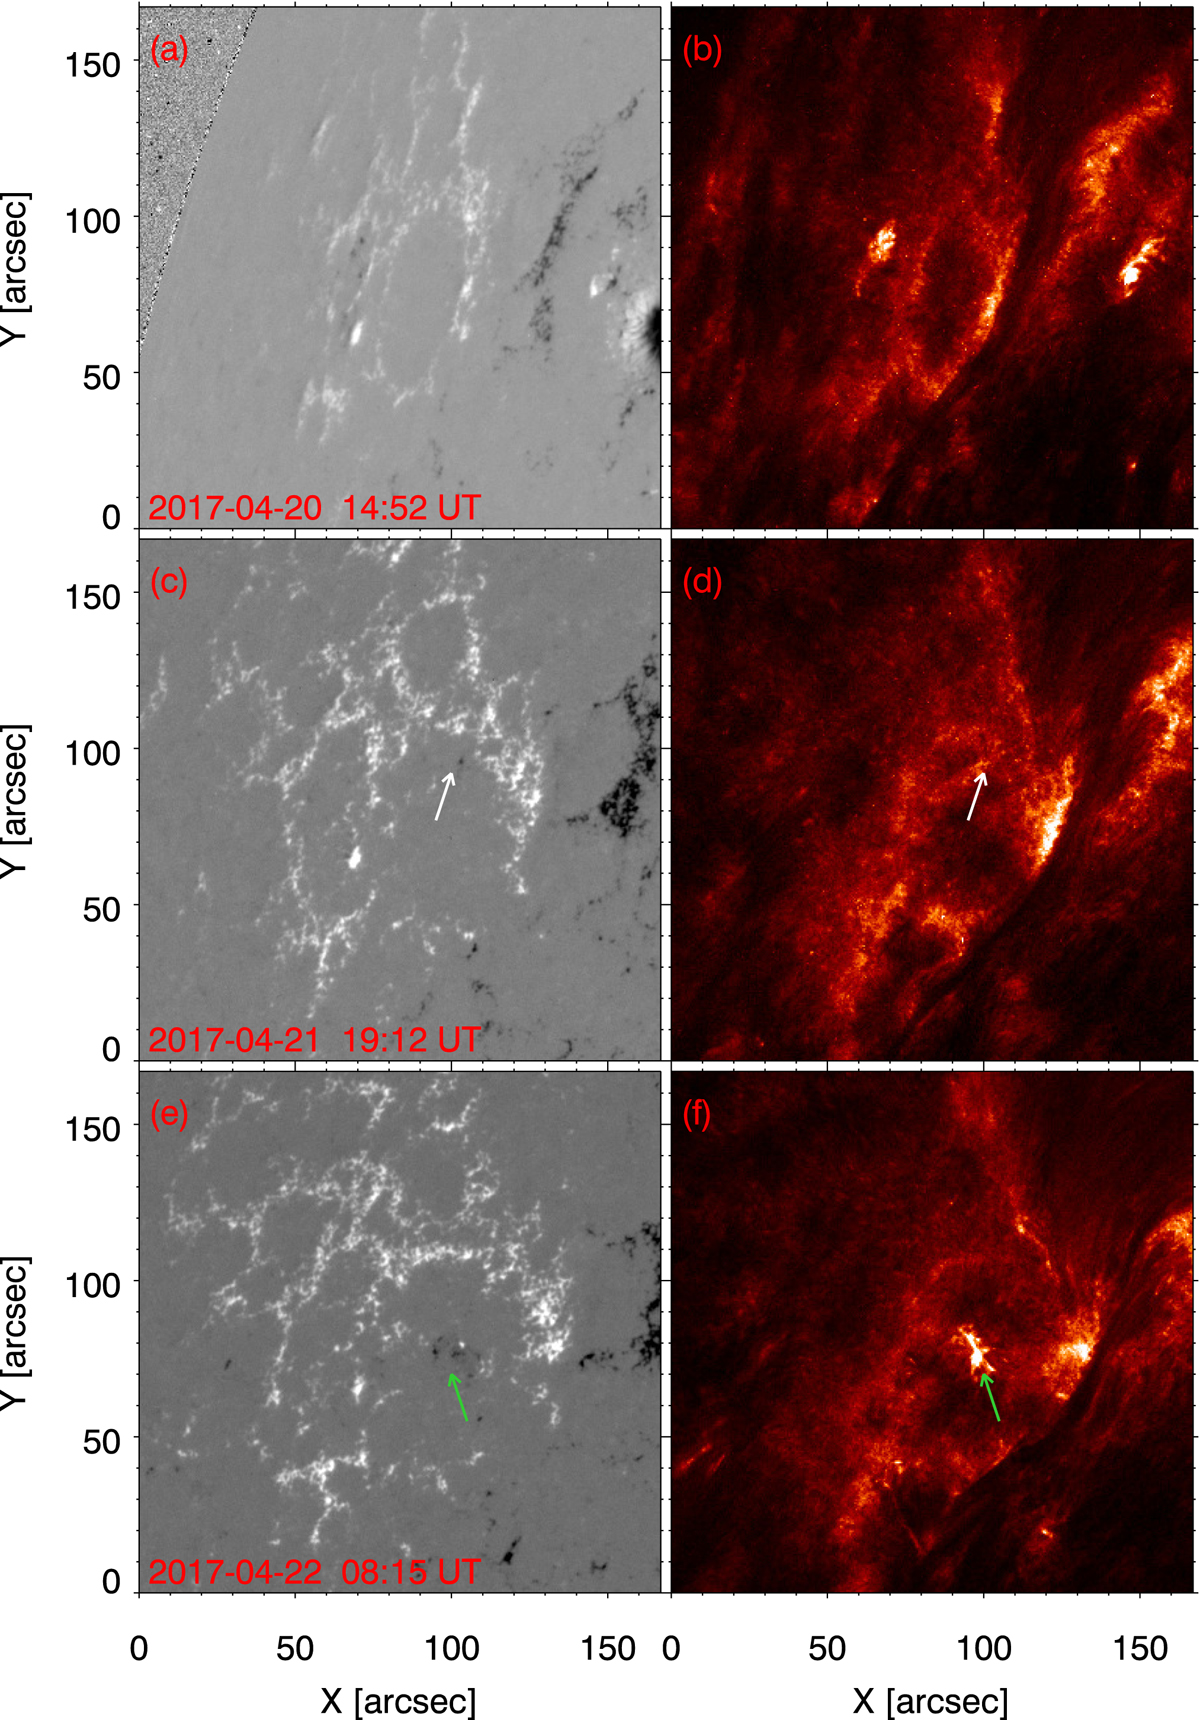
Left column: HMI line-of-sight magnetogram of the super granular structure. Right column: AIA 304 images for the same field of view as the left column. First row: data acquired on the same day of CRISP observations (panels a and b). Middle and last row: data obtained one (panels c and d) and two (panels e and f) days later. The green and white arrows indicate flux emergence events. The north direction coincides with the top side of the panels.
Current usage metrics show cumulative count of Article Views (full-text article views including HTML views, PDF and ePub downloads, according to the available data) and Abstracts Views on Vision4Press platform.
Data correspond to usage on the plateform after 2015. The current usage metrics is available 48-96 hours after online publication and is updated daily on week days.
Initial download of the metrics may take a while.