Fig. 10.
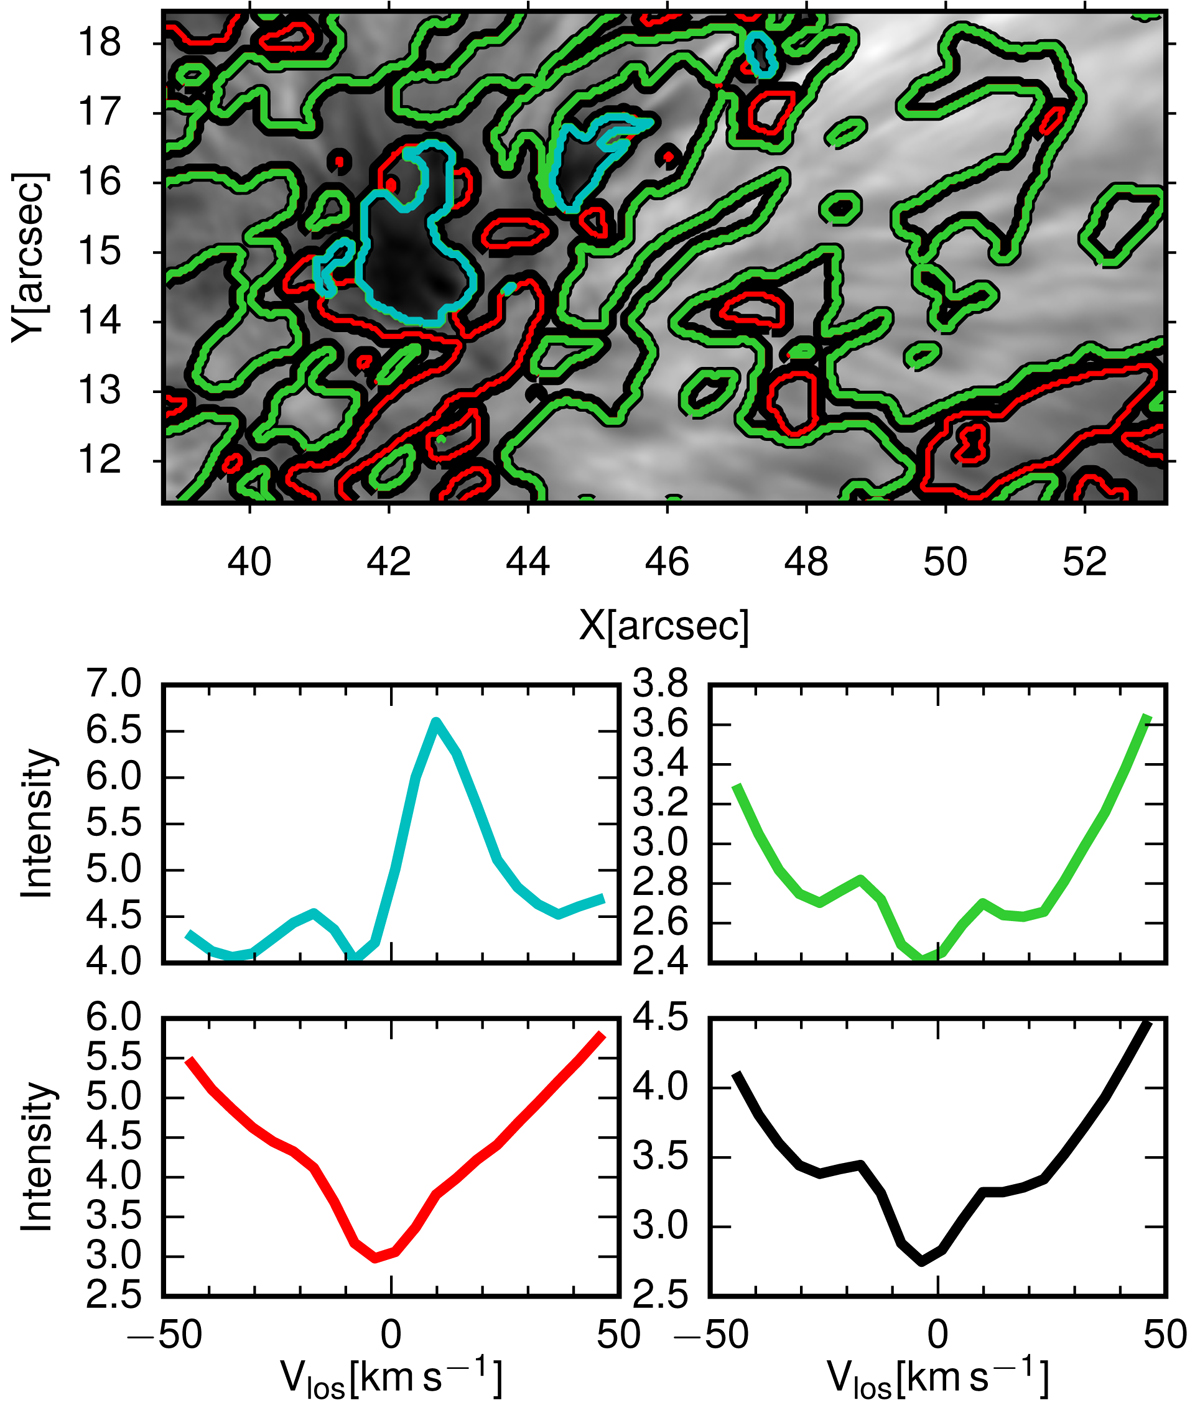
K-mean clustering of the spectral profiles of the inset of Fig. 9a. Each contour delimits the area where the profiles are closer to the corresponding coloured average profile. The upper image has reversed intensity and the intensity scales of the last four panels are in units of 10−7 erg cm−2 s−1 Hz−1 ster−1. The Y-axes have different scales.
Current usage metrics show cumulative count of Article Views (full-text article views including HTML views, PDF and ePub downloads, according to the available data) and Abstracts Views on Vision4Press platform.
Data correspond to usage on the plateform after 2015. The current usage metrics is available 48-96 hours after online publication and is updated daily on week days.
Initial download of the metrics may take a while.