Fig. 4.
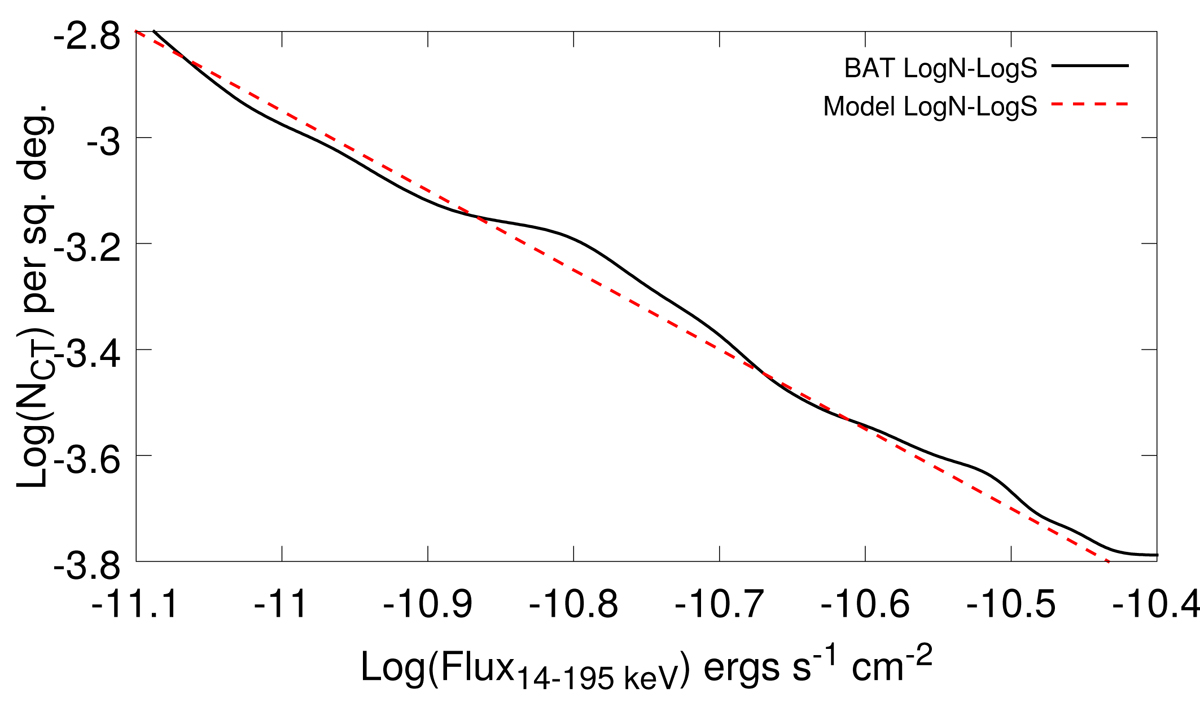
Number count distribution of the Compton-thick AGNs derived from the Neil Gehrels Swift-BAT survey in Akylas et al. (2016, black solid line). The red dashed line denotes the prediction of the X-ray population synthesis model of Akylas et al. (2012). Using the spectral parameters found in our spectral fits, we find that the Compton-thick AGNs fraction should be 20% of the type-2 AGNs population to agree with the observed logN − logS.
Current usage metrics show cumulative count of Article Views (full-text article views including HTML views, PDF and ePub downloads, according to the available data) and Abstracts Views on Vision4Press platform.
Data correspond to usage on the plateform after 2015. The current usage metrics is available 48-96 hours after online publication and is updated daily on week days.
Initial download of the metrics may take a while.