Free Access
Fig. 9
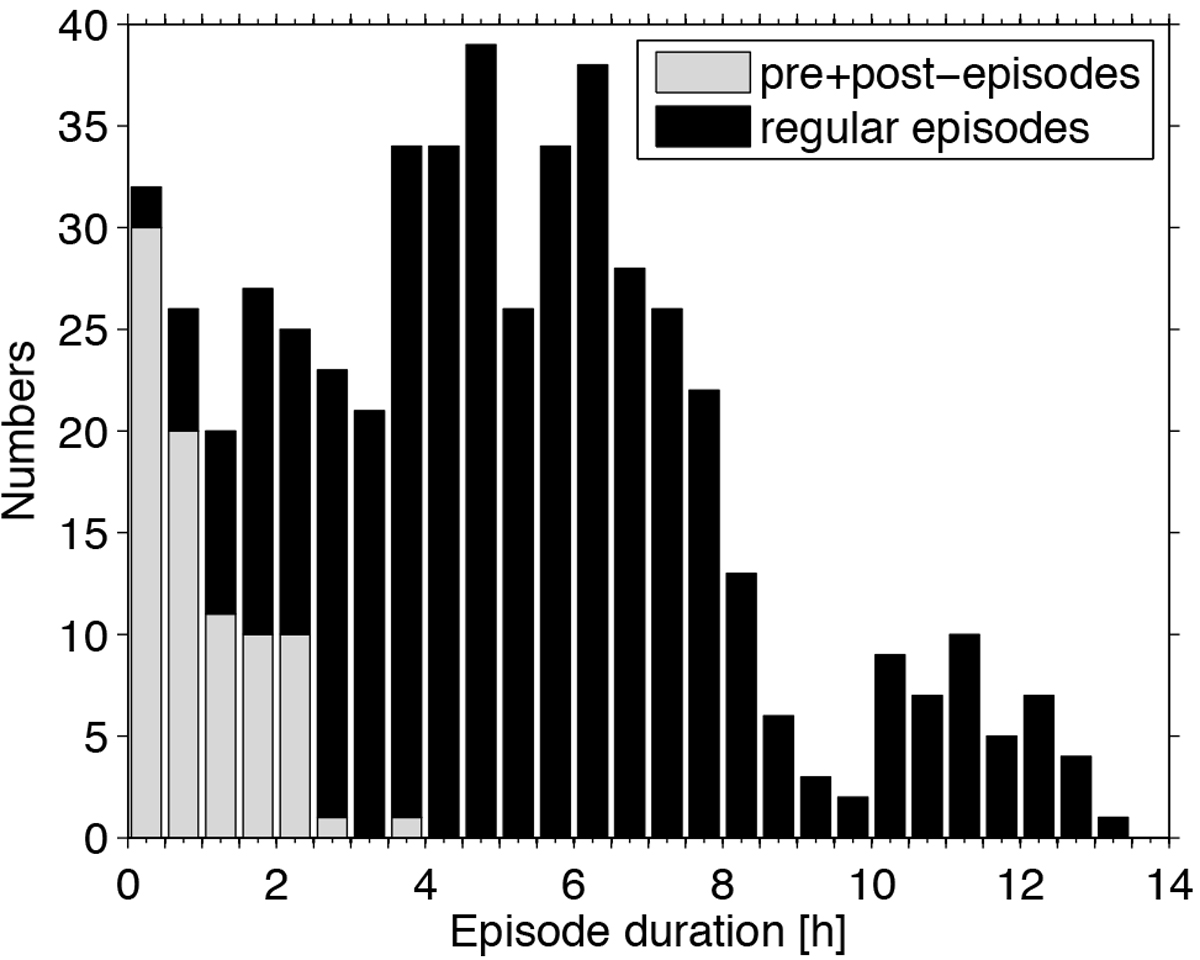
Distribution of SED storm F episode durations in half hour bins in a stacked histogram. The distribution contains 522 values, which includes 439 regular episodes, 49 pre-episodes, and 34 post-episodes.
Current usage metrics show cumulative count of Article Views (full-text article views including HTML views, PDF and ePub downloads, according to the available data) and Abstracts Views on Vision4Press platform.
Data correspond to usage on the plateform after 2015. The current usage metrics is available 48-96 hours after online publication and is updated daily on week days.
Initial download of the metrics may take a while.