Fig. 8
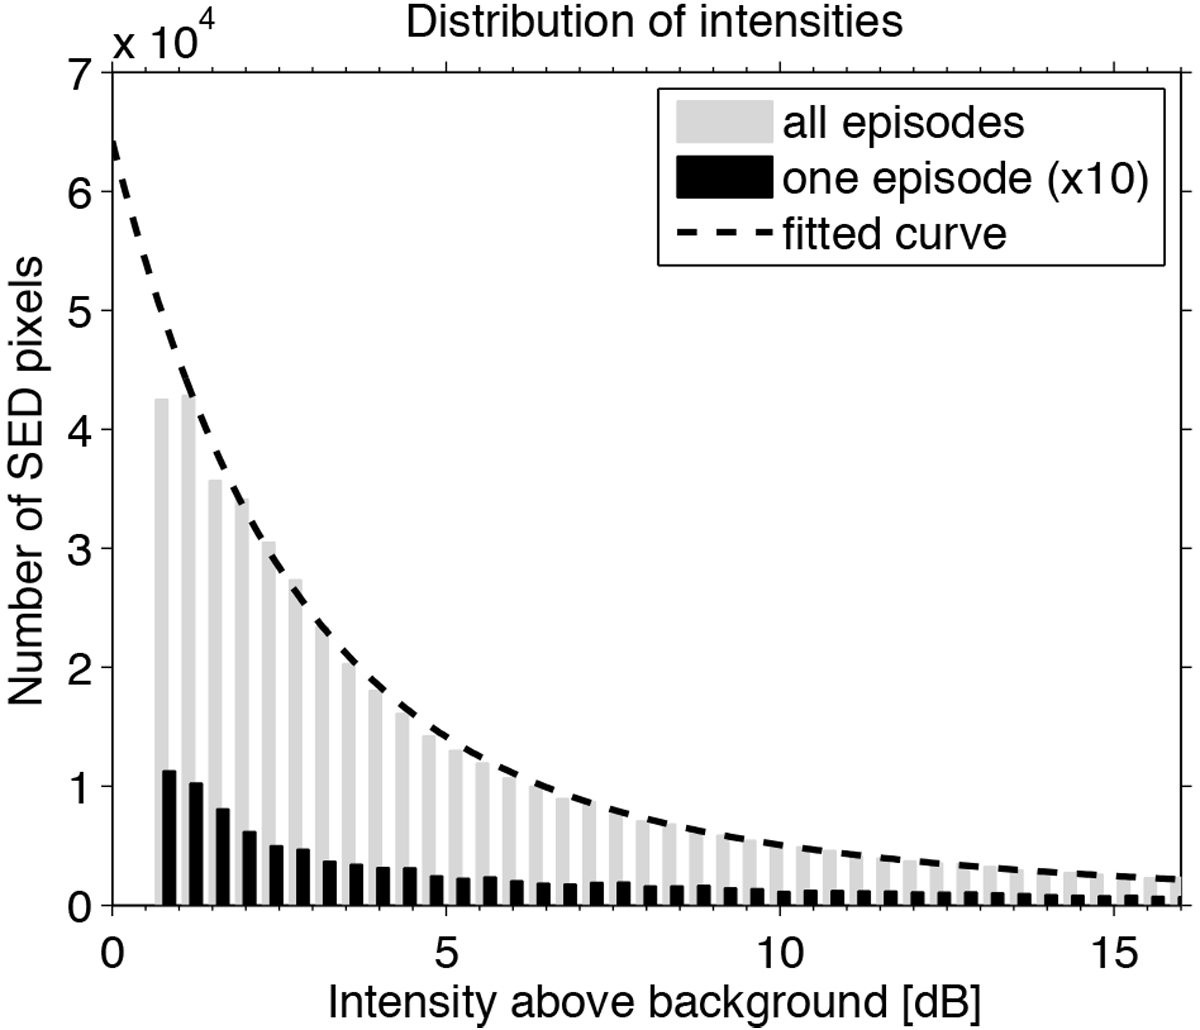
Distribution of SED pixel intensities of storm F with a bin size of 0.4 dB. The gray bars represent all SED pixels, and the black bars show the distribution of pixels from a single SED episode, the closest approach episode of 10 May 2008 before noon. For a better visibility the black bars of the single episode are magnified by a factor of 10 with respect to the scale on the ordinate. The dashed fitted curve is given by the two-term exponential model of Eq. (4).
Current usage metrics show cumulative count of Article Views (full-text article views including HTML views, PDF and ePub downloads, according to the available data) and Abstracts Views on Vision4Press platform.
Data correspond to usage on the plateform after 2015. The current usage metrics is available 48-96 hours after online publication and is updated daily on week days.
Initial download of the metrics may take a while.