Fig. 7
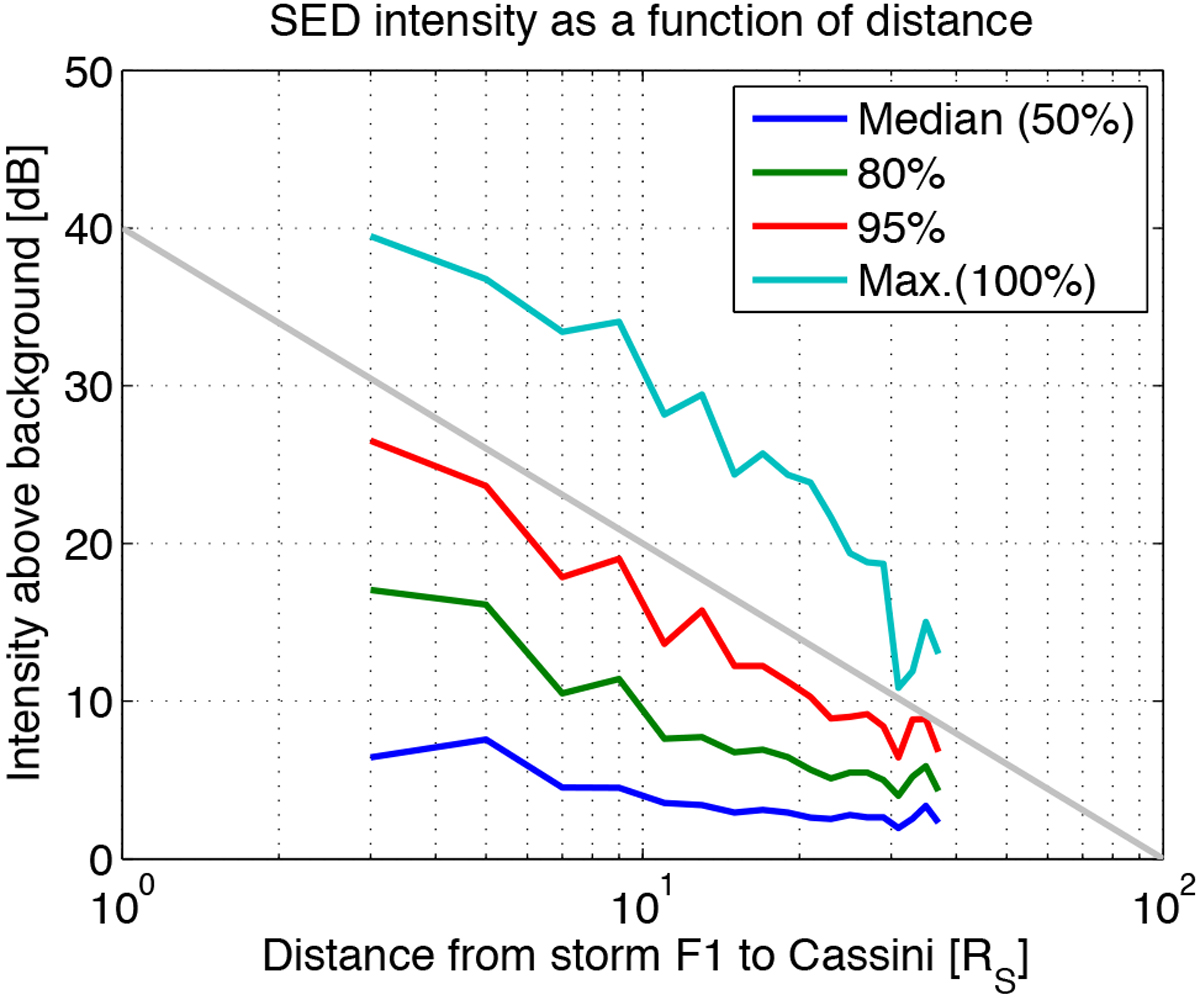
Intensities of SED storm F pixels as a function of distance between storm F1 and Cassini. The data was divided in 18 distance intervals with a bin size of 2 RS, centered at the values of 3, 5, 7,... 37 RS. For each interval we calculated the median intensity value (50% percentile, blue curve), the 80% percentile (green curve), the 95% percentile (red curve), and the maximum (100% percentile, cyan curve). The gray line represents an inverse-square law (![]() ) dependence.
) dependence.
Current usage metrics show cumulative count of Article Views (full-text article views including HTML views, PDF and ePub downloads, according to the available data) and Abstracts Views on Vision4Press platform.
Data correspond to usage on the plateform after 2015. The current usage metrics is available 48-96 hours after online publication and is updated daily on week days.
Initial download of the metrics may take a while.