Fig. 4
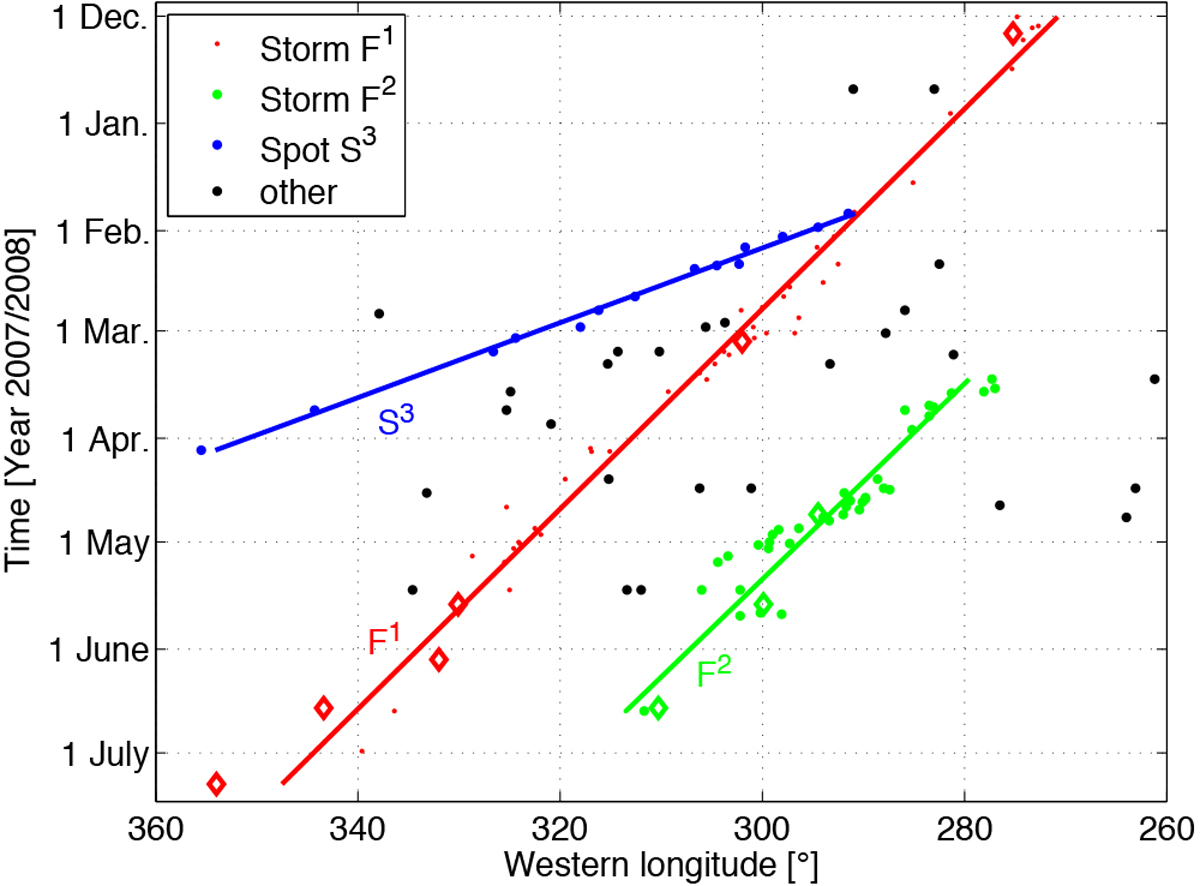
Location of cloud features as a function of time as imaged by Cassini (diamonds) and ground-based amateur astronomers (dots). All longitudes in this figure and paper are western longitudes in degrees of Voyager SLS. The x-axis was inverted to have larger western longitudes on the left side. The y-axis goes from the start of storm F (27 November 2007) until its end (15 July 2008) with the start of the storm on the top. The different colors denote the storm cells F1, F2 and spot S3 as discussed in the text.
Current usage metrics show cumulative count of Article Views (full-text article views including HTML views, PDF and ePub downloads, according to the available data) and Abstracts Views on Vision4Press platform.
Data correspond to usage on the plateform after 2015. The current usage metrics is available 48-96 hours after online publication and is updated daily on week days.
Initial download of the metrics may take a while.