Fig. 2
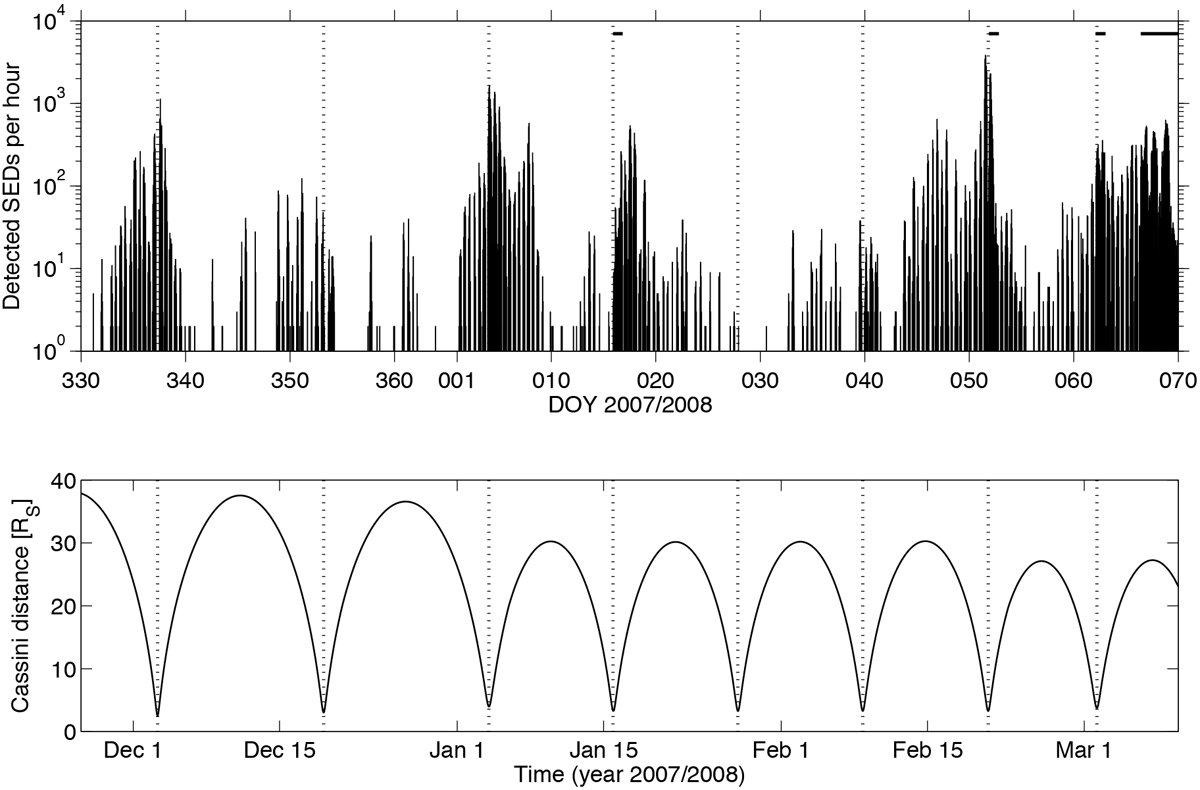
Number of detected SEDs per hour in logarithmic scale as a function of time (in DOY 2007/2008, upper panel), and radial distance of Cassini as function of time (lower panel). This figure gives the first part of SED storm F from late November 2007 until 9/10 March 2008. The periapse times are marked by dotted vertical lines in both panels. The horizontal lines at the top indicate times when SED episodes lasted for a full Saturn rotation.
Current usage metrics show cumulative count of Article Views (full-text article views including HTML views, PDF and ePub downloads, according to the available data) and Abstracts Views on Vision4Press platform.
Data correspond to usage on the plateform after 2015. The current usage metrics is available 48-96 hours after online publication and is updated daily on week days.
Initial download of the metrics may take a while.