Fig. 14
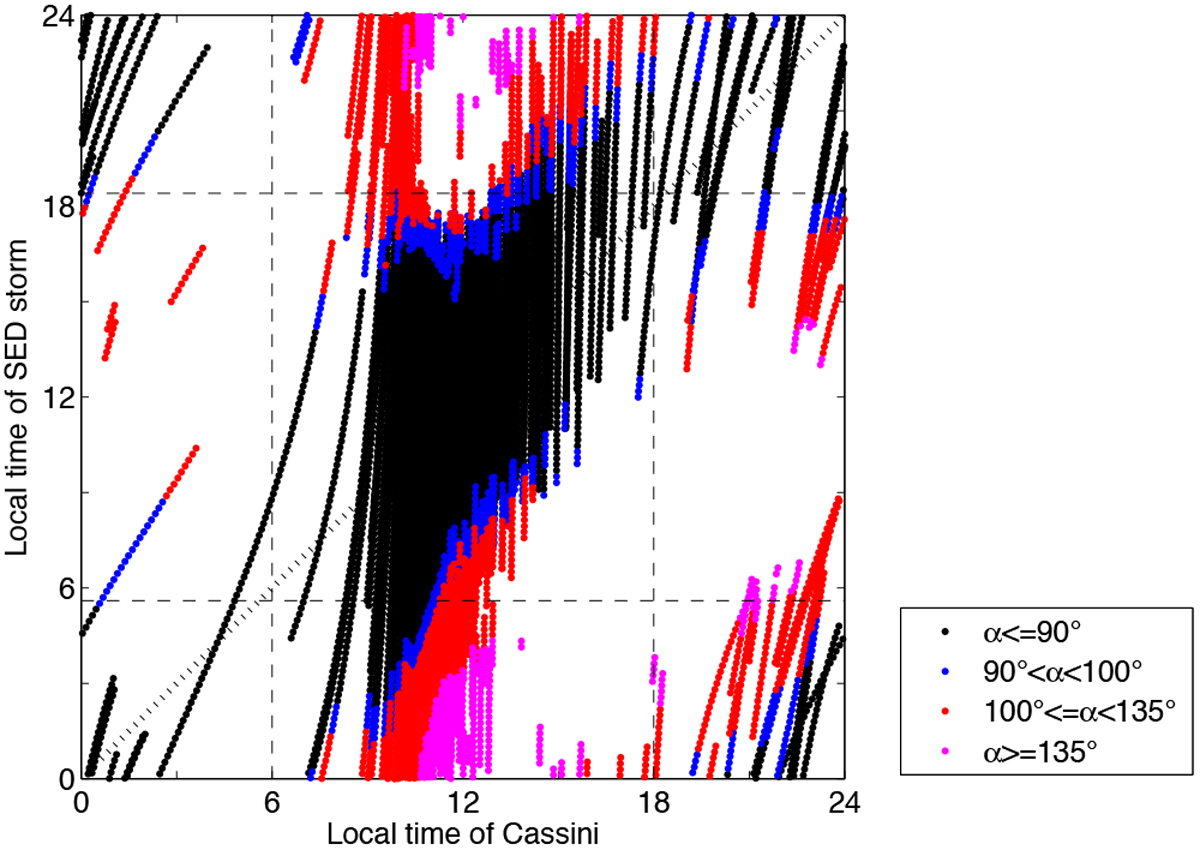
Occurrence of SEDs as a function of the local time of Cassini and the local time of the storm cell F1. The different colors classify the SEDs by their emission angle α, i.e., the angle between the local zenith at the storm and Cassini. The black dots show all “direct” SEDs (α ≤ 90°), which propagate in a straight line from the storm to Cassini. The blue and red points show the over-the-horizon (OTH) SEDs in the range of 90° < α < 100° and 100° ≤ α < 135°, respectively. The magenta points show the extreme OTH SEDs with α ≥ 135°. Additionally, the dashed lines separate the day side from the night side (SED storm at 35° south has a solar zenith angle of 90° at local times of 5.6 h and 18.4 h.) For clarity of the plot we have restricted the data to latitudes of Cassini within ± 45° vfrom the equatorial plane, and we have excluded the time from 6–10 March due to the presence of another storm.
Current usage metrics show cumulative count of Article Views (full-text article views including HTML views, PDF and ePub downloads, according to the available data) and Abstracts Views on Vision4Press platform.
Data correspond to usage on the plateform after 2015. The current usage metrics is available 48-96 hours after online publication and is updated daily on week days.
Initial download of the metrics may take a while.