Fig. 12
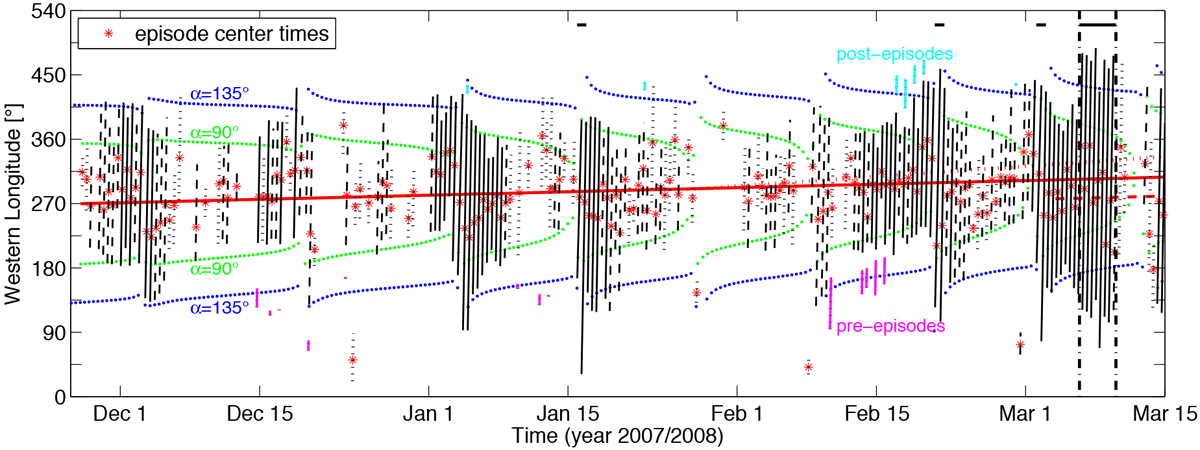
Subspacecraft western longitude ranges of SED episodes from the end of November 2007 until mid-March 2008. The western longitude ranges are displayed as almost vertical black lines. These lines are dotted for SED episodes with less than 20 SEDs, dashed for episodes with more than 20 but less than 200 SEDs, and solid for episodes with greater than or equal to 200 SEDs. For each episode the red asterisk marks the western longitude at the center time of the respective episode (i.e., mean time of all SEDs from this episode). The western longitude ranges of pre-episodes are colored in magenta, and the ranges of post-episodes are colored in cyan. The almost horizontal red lines indicate the western longitudes of the storm cells F1 (red solid line), F2 (red dashed line), and S3 (red dottedline), respectively. Similar to Fig. 2, the black horizontal lines on top indicate times when SED episodes lasted for a full Saturn rotation, which means that the western longitude range goes up to 360° for such episodes. Additionally, the interval of continuous SED detections from 6–10 March is indicated by black vertical dot-dashed lines. The green dots mark the times and subspacecraft western longitudes when the emission angle α is 90°, and the blue dots indicate the times and western longitudes for α = 135°. The angle α is defined as the angle between the local zenith at the location of SED storm F1 and the vector from the SED storm to Cassini. More detailed explanations can be found in the text.
Current usage metrics show cumulative count of Article Views (full-text article views including HTML views, PDF and ePub downloads, according to the available data) and Abstracts Views on Vision4Press platform.
Data correspond to usage on the plateform after 2015. The current usage metrics is available 48-96 hours after online publication and is updated daily on week days.
Initial download of the metrics may take a while.