Free Access
Fig. 11
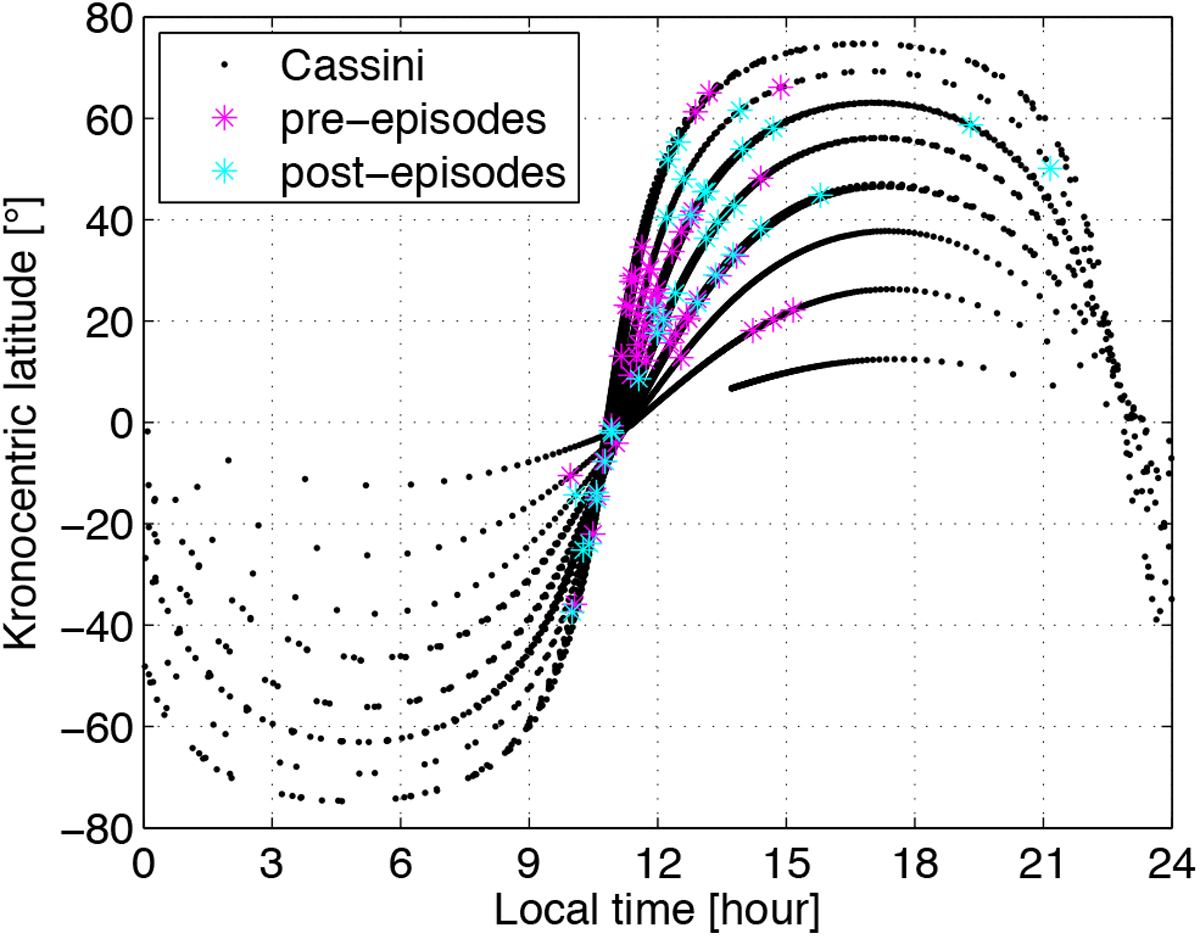
Local time and kronocentric latitude of Cassini during the recording of pre-episodes (magenta stars) and post-episodes (cyan stars). The black dots show the position of Cassini in local time and latitude from 27 November 2007 until 15 July 2008 with a resolution of one dot per hour.
Current usage metrics show cumulative count of Article Views (full-text article views including HTML views, PDF and ePub downloads, according to the available data) and Abstracts Views on Vision4Press platform.
Data correspond to usage on the plateform after 2015. The current usage metrics is available 48-96 hours after online publication and is updated daily on week days.
Initial download of the metrics may take a while.