Fig. 10
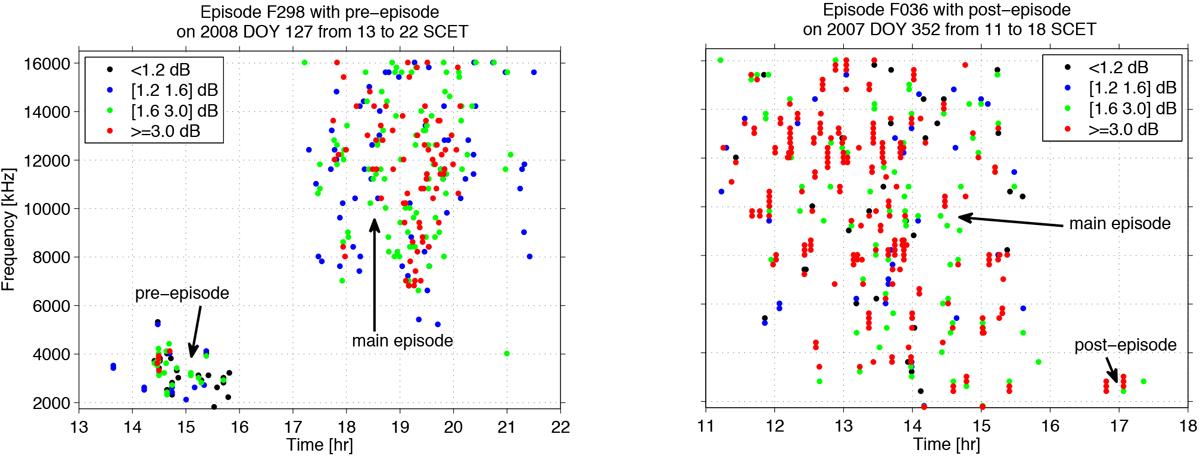
Sample episodes with pre- and post-episodes. Left panel: storm episode F298 with a pre-episode. Right panel: episode F036 with a post-episode. We show the extracted SEDs displayed versus time (in hours of SCET, spacecraft event time) and frequency. The frequency range (with linear scale from 1.8 to 16.2 MHz) in the left and right panels are exactly the same. In the left panel nine hours are displayed, and in the right panel it is seven hours. The colors indicate the SED pixel intensities in dB above background.
Current usage metrics show cumulative count of Article Views (full-text article views including HTML views, PDF and ePub downloads, according to the available data) and Abstracts Views on Vision4Press platform.
Data correspond to usage on the plateform after 2015. The current usage metrics is available 48-96 hours after online publication and is updated daily on week days.
Initial download of the metrics may take a while.