Fig. 8
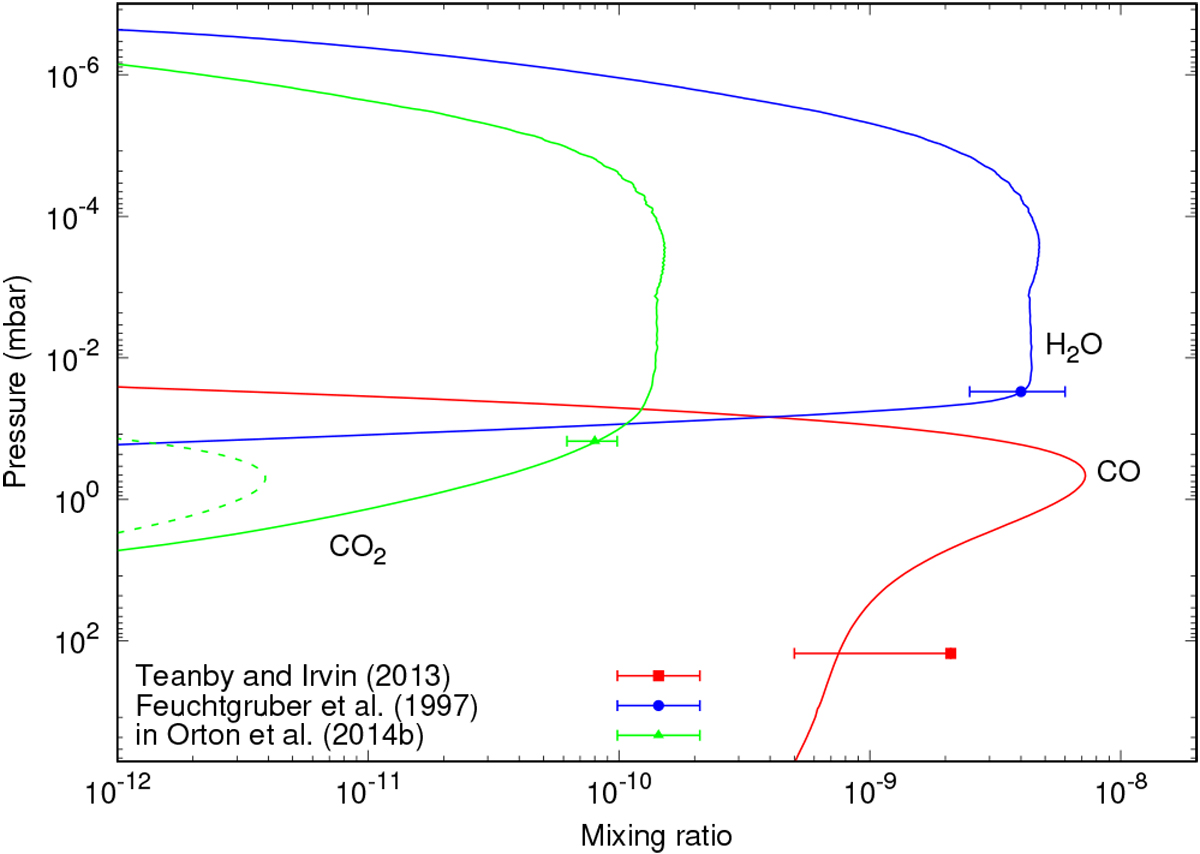
Vertical profiles of H2O, CO, and CO2 derived fromthe time-dependent model under these assumptions: (i) 1.1 × 10¹⁵ gr of CO are brought to the planet via a cometary impact ~630 yr ago (case 3 in Table 4), and (ii) vapour water input is due to the ablation of ice grains (Moses & Poppe 2017) with an integrated rate of 6.0 × 104 cm−2 s−1. Red solid line: CO, blue solid line: H2O, dashed green line: CO2 only produced by chemical processes, and green solid line: carbon dioxide when an integrated ice grain ablation rate of 4.5 × 104 cm−2 s−1 is considered as well.
Current usage metrics show cumulative count of Article Views (full-text article views including HTML views, PDF and ePub downloads, according to the available data) and Abstracts Views on Vision4Press platform.
Data correspond to usage on the plateform after 2015. The current usage metrics is available 48-96 hours after online publication and is updated daily on week days.
Initial download of the metrics may take a while.