Fig. 5
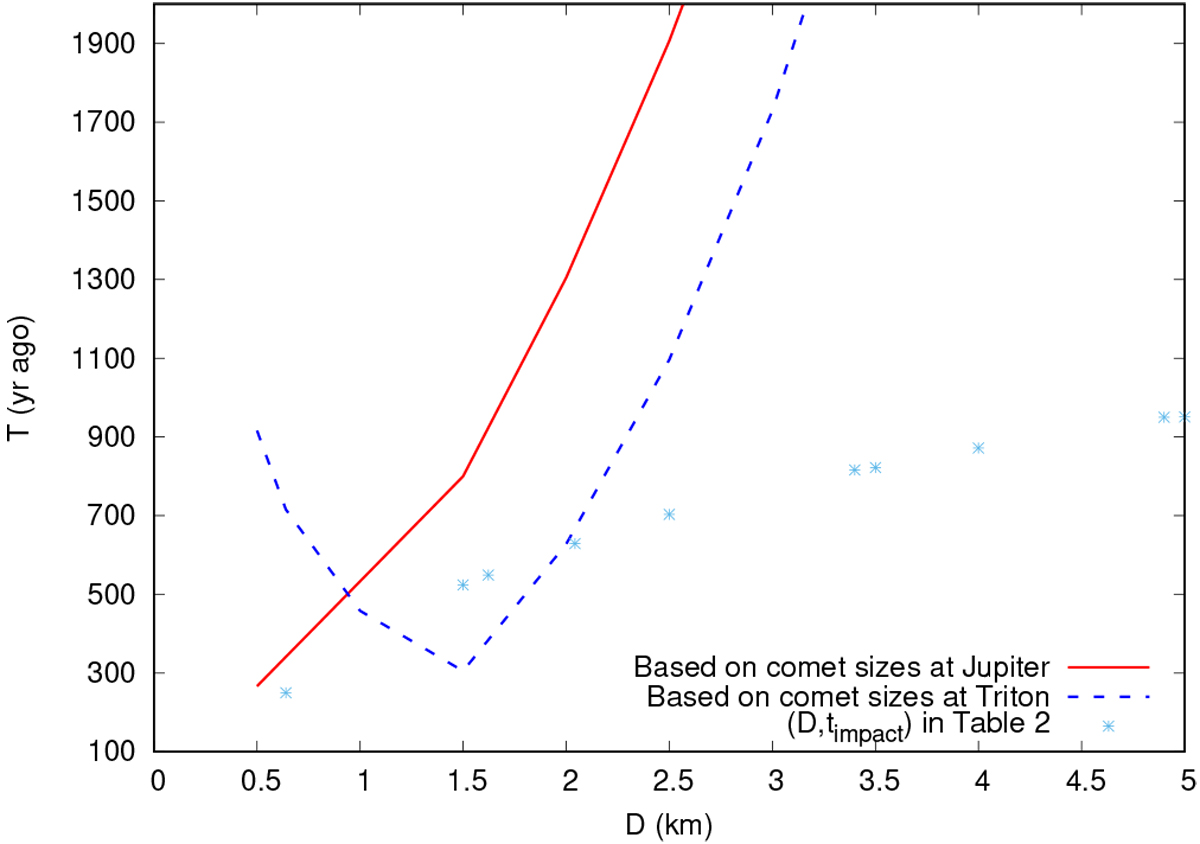
Inverse of the impact frequency (in units of years ago) versus impactor size D on Uranus for two different scenarios: impactors in which the size–number distribution of impactors represent ecliptic comets (red solid line), and nearly isotropic comets such as long-period and Halley-type comets (blue dashed line; see Zahnle et al. 2003, and references therein). Stars show the (D, timpact) from Table 4 that allows for an optimal match of Herschel CO data in the stratosphere and below the upper limit in the troposphere (Teanby & Irwin 2013).
Current usage metrics show cumulative count of Article Views (full-text article views including HTML views, PDF and ePub downloads, according to the available data) and Abstracts Views on Vision4Press platform.
Data correspond to usage on the plateform after 2015. The current usage metrics is available 48-96 hours after online publication and is updated daily on week days.
Initial download of the metrics may take a while.