Free Access
Fig. 4
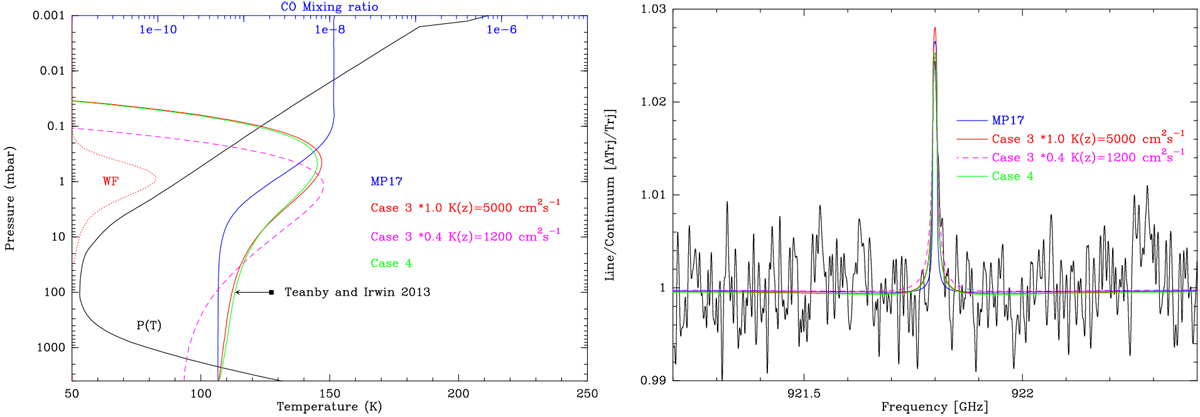
Comparison of the CO line observed with Herschel and the spectra computed with the resulting CO vertical profile pertaining to model MP17, nominal case 3 (K(z) = 5000 cm2 s−1), 40% of qCO resulting from case 3 with K(z) = 1200 cm2 s−1, and case 4 in Table 4. WF denotes the weighting function at the line centre.
Current usage metrics show cumulative count of Article Views (full-text article views including HTML views, PDF and ePub downloads, according to the available data) and Abstracts Views on Vision4Press platform.
Data correspond to usage on the plateform after 2015. The current usage metrics is available 48-96 hours after online publication and is updated daily on week days.
Initial download of the metrics may take a while.