Fig. 9.
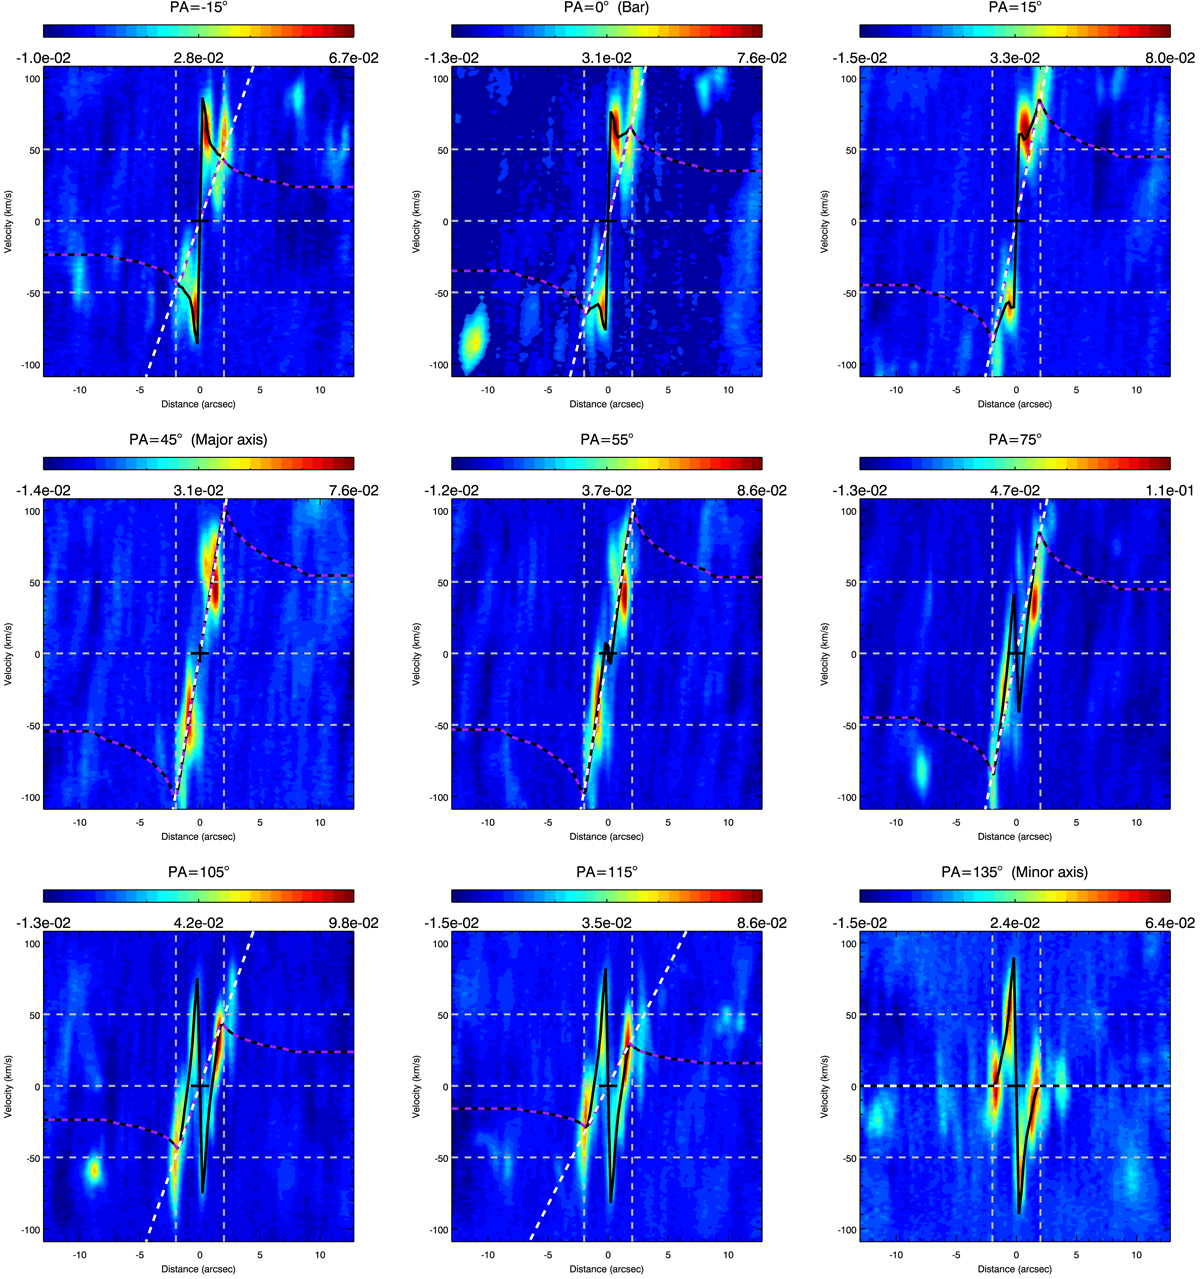
Position-velocity diagrams of the CO J:2-1 emission in NGC 1566 along several PAs are shown in color following the color bar above each panel. The PA of the “slit” over which the pv diagram was extracted is indicated above each panel, as are the PAs corresponding to the major and minor axis of the galaxy, and of the large-scale bar. Negative offsets on the x-axis correspond to the PA listed above the panel, i.e., positive offsets are along the 180° plus the listed PA. The black cross indicates the position of the 230 GHz continuum peak (presumed to be the galaxy center) and the systemic velocity of the CO J:2-1 line (1485 km s−1). To guide the eye horizontal and vertical lines delineate ±2 arcsec from the nucleus and ±50 km s−1 from the systemic velocity. The dashed white and purple lines are the solid body rotation model and the ModC2014 rotation model, respectively. The solid black line shows the expectation of adding our outflow model to the ModC2014 model (see Sect. 3.3). The pv diagrams, were created from a “hybrid” datacube: the inner ∼12″ × 12″ square region centered on the nucleus is taken from a high-resolution (Briggs weighting, Robust = −2) map with spatial resolution ![]() ×
× ![]() and an r.m.s. noise of 0.1 mJy beam−1 per channel (up to 2 mJy beam−1 per channel in channels with strong signal), while the rest of the cube is from a higher signal-to-noise (Briggs weighting, Robust = 2) map with spatial resolution
and an r.m.s. noise of 0.1 mJy beam−1 per channel (up to 2 mJy beam−1 per channel in channels with strong signal), while the rest of the cube is from a higher signal-to-noise (Briggs weighting, Robust = 2) map with spatial resolution ![]() ×
× ![]() and an r.m.s. noise of 1.2 mJy beam−1 per channel (up to 4 mJy beam−1 per channel in channels with strong signal).
and an r.m.s. noise of 1.2 mJy beam−1 per channel (up to 4 mJy beam−1 per channel in channels with strong signal).
Current usage metrics show cumulative count of Article Views (full-text article views including HTML views, PDF and ePub downloads, according to the available data) and Abstracts Views on Vision4Press platform.
Data correspond to usage on the plateform after 2015. The current usage metrics is available 48-96 hours after online publication and is updated daily on week days.
Initial download of the metrics may take a while.