Fig. 8.
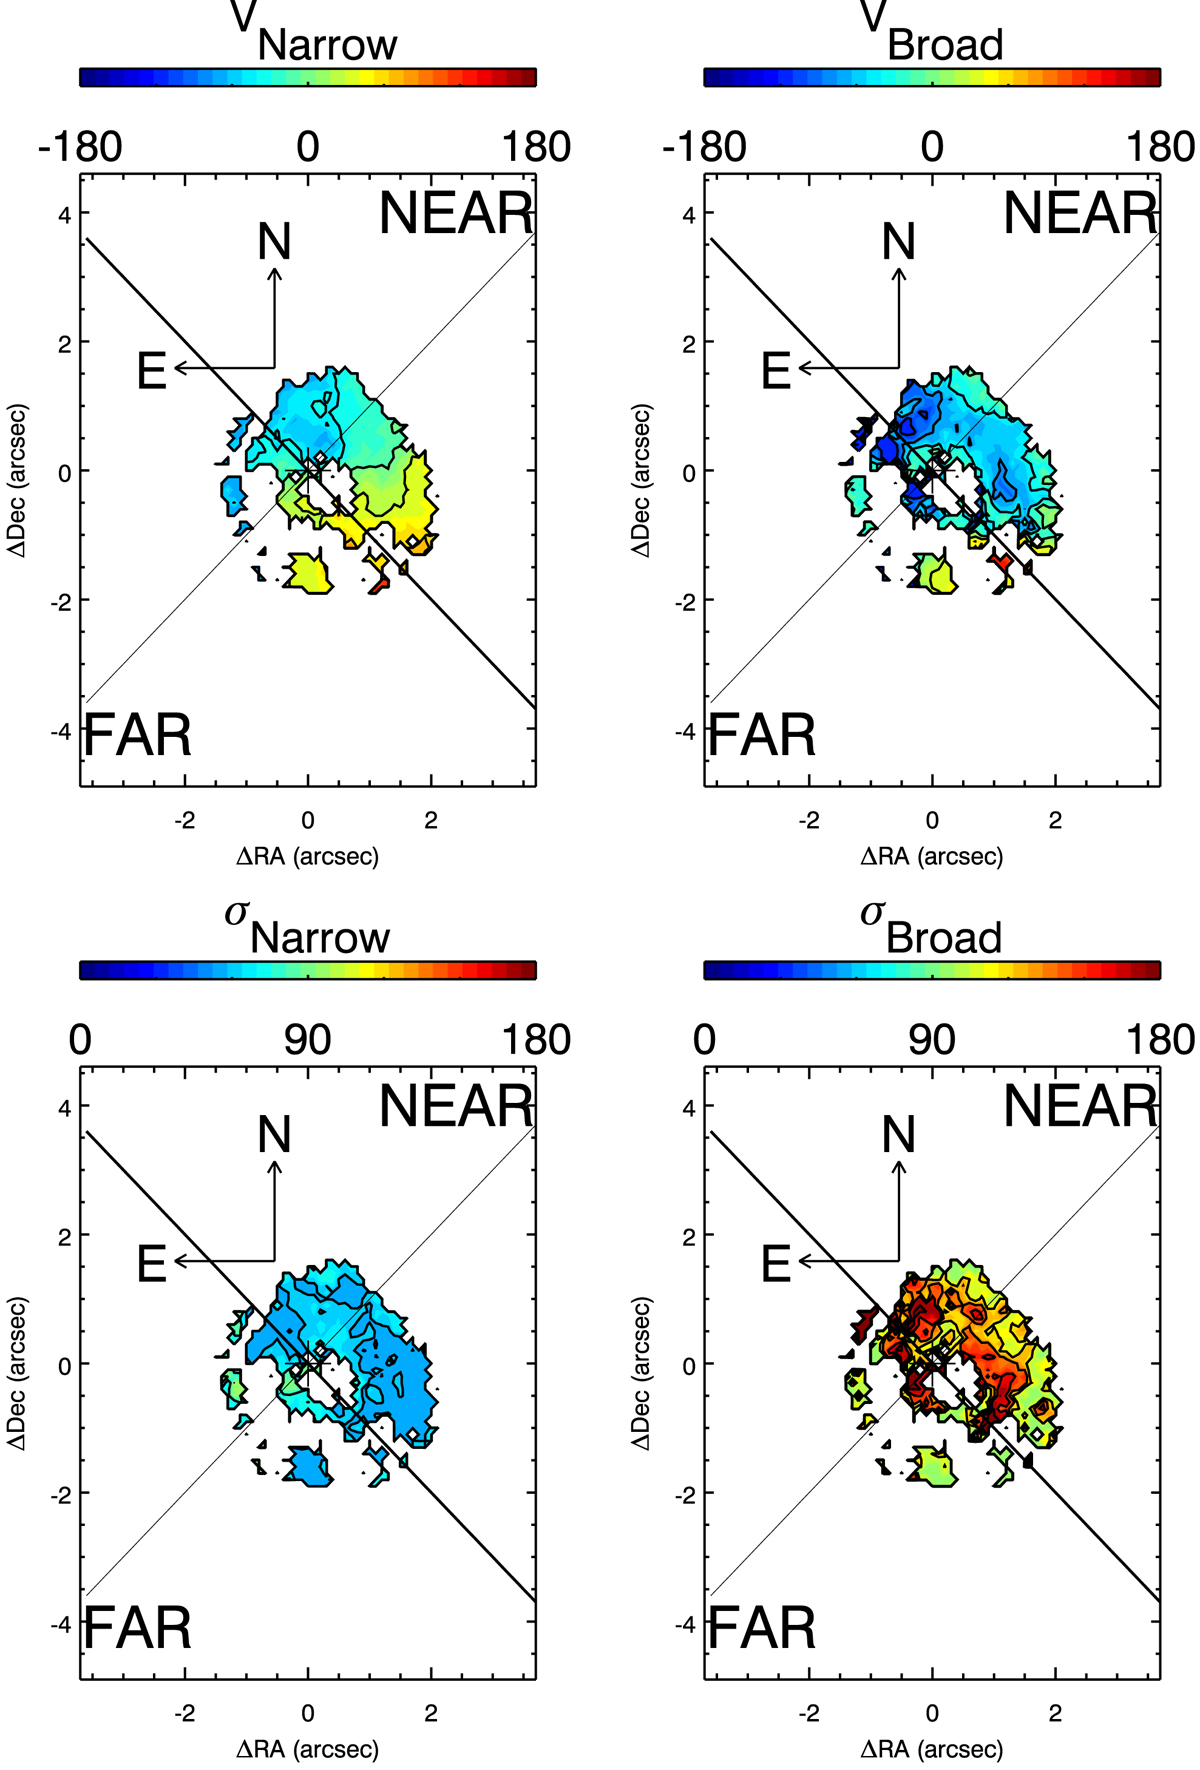
Velocity and dispersion maps of the [N II] emission line obtained from the two-Gaussian fit version of profit.pro. Top panels: from left to right, the velocity and velocity dispersion maps of the narrow and broad components, respectively. Bottom panels: velocity dispersion maps of the narrow (left panel) and broad (right panel) components.
Current usage metrics show cumulative count of Article Views (full-text article views including HTML views, PDF and ePub downloads, according to the available data) and Abstracts Views on Vision4Press platform.
Data correspond to usage on the plateform after 2015. The current usage metrics is available 48-96 hours after online publication and is updated daily on week days.
Initial download of the metrics may take a while.