Fig. 7.
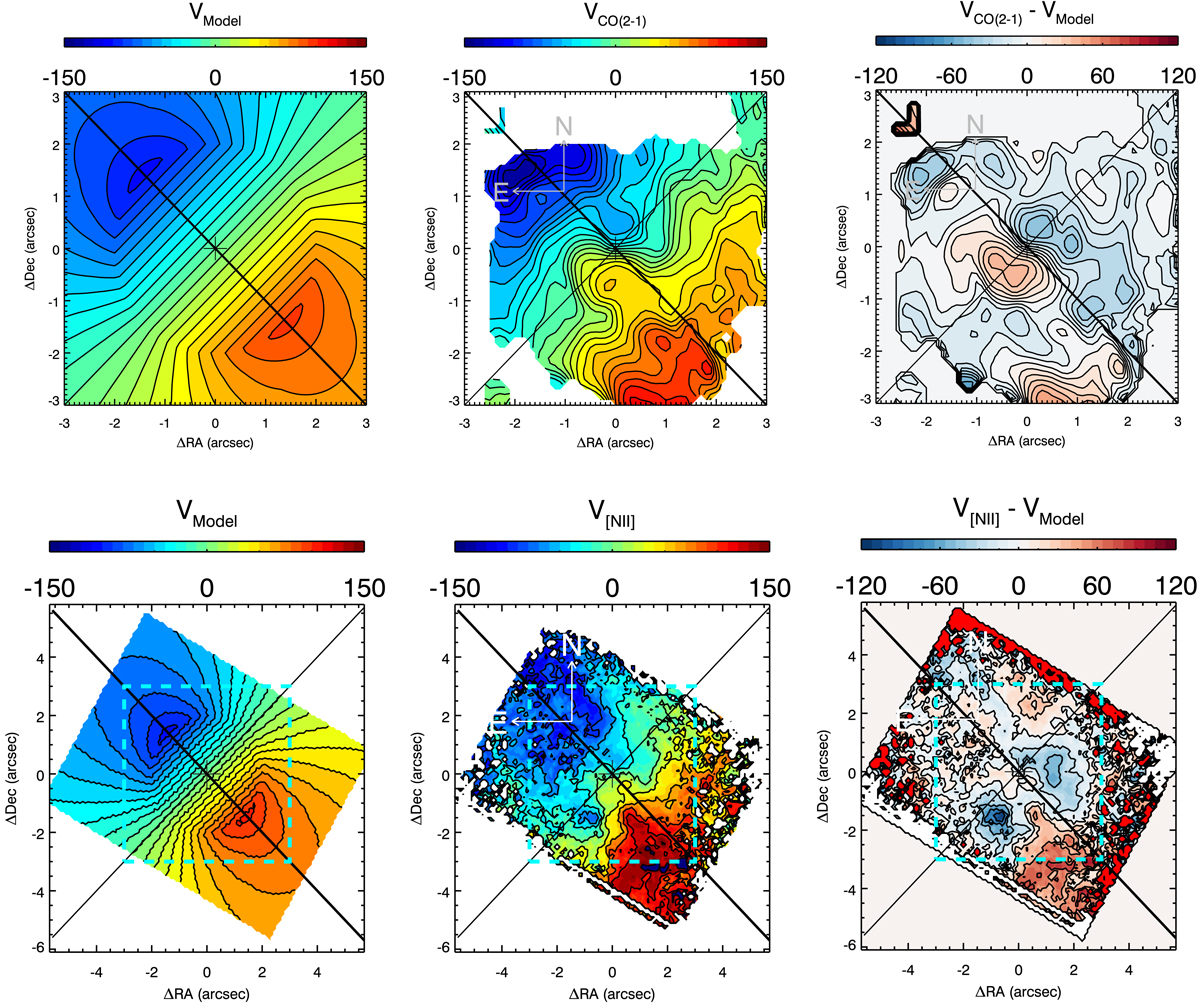
Nuclear velocity field of NGC 1566 in the CO J:2-1 (top row) and [N II] 6583 Å (bottom row) emission lines, in contours and color following the color bar above each panel. The left column shows the expected radial velocity field from the ModC2014 model (see text), the middle column shows the observed radial velocity, and the right column shows the residual velocities (observed − model). A cyan dashed squares were drawing inside bottom panels for showing the FOV of top panels. In these figures we use a systemic velocity of 1485 km s−1and the nuclear position (marked with a cross) is determined by the 230 GHz continuum emission peak. The major (PA = 45°) and minor axes are shown in solid lines. One arcsecond corresponds to 0. pc.
Current usage metrics show cumulative count of Article Views (full-text article views including HTML views, PDF and ePub downloads, according to the available data) and Abstracts Views on Vision4Press platform.
Data correspond to usage on the plateform after 2015. The current usage metrics is available 48-96 hours after online publication and is updated daily on week days.
Initial download of the metrics may take a while.