Fig. 6.
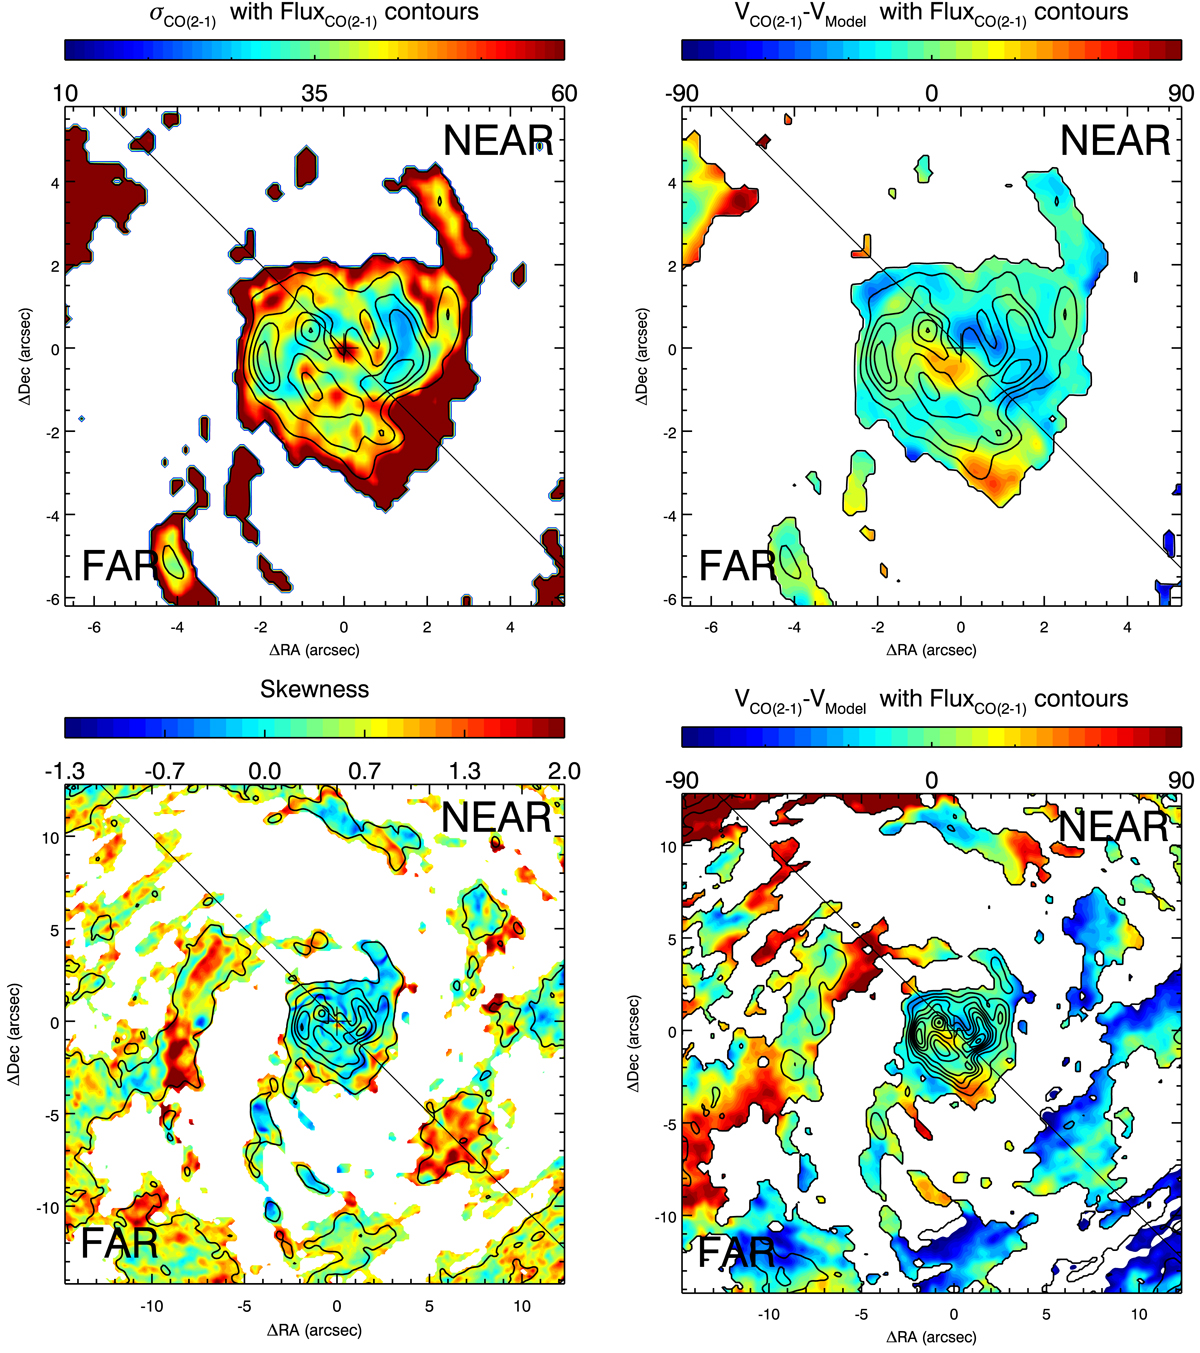
Top panel: maps of the CO J:2-1 velocity dispersion (left panel) and velocity residuals after subtraction of the ModC2014 rotation model (right panel) for the inner FOV. Contours in both panels show the moment 0 (integrated flux) map of the CO J:2-1 emission, ranging from 0.4 mJy beam−1 km s−1 to 5.4 mJy beam−1 km s−1. Bottom left panel: moment 3 (skewness) map of the CO J:2-1 emission for the larger FOV, shown in color following the color bar: blue colors represent spectra with excess emission towards the blue side of the weighted mean velocity. The CO Moment 0 (total flux) map is overlaid with black contours. Bottom right panel: as in the top right panel but for the larger FOV. Pixels with velocity less than −90 km s−1 in the right panels are shown in white. Contours in bottom panels show the moment 0 (integrated flux) map of the CO J:2-1 emission, ranging from 0.4 mJy beam−1 km s−1 to 8.4 mJy beam−1 km s−1.
Current usage metrics show cumulative count of Article Views (full-text article views including HTML views, PDF and ePub downloads, according to the available data) and Abstracts Views on Vision4Press platform.
Data correspond to usage on the plateform after 2015. The current usage metrics is available 48-96 hours after online publication and is updated daily on week days.
Initial download of the metrics may take a while.