Fig. 5.
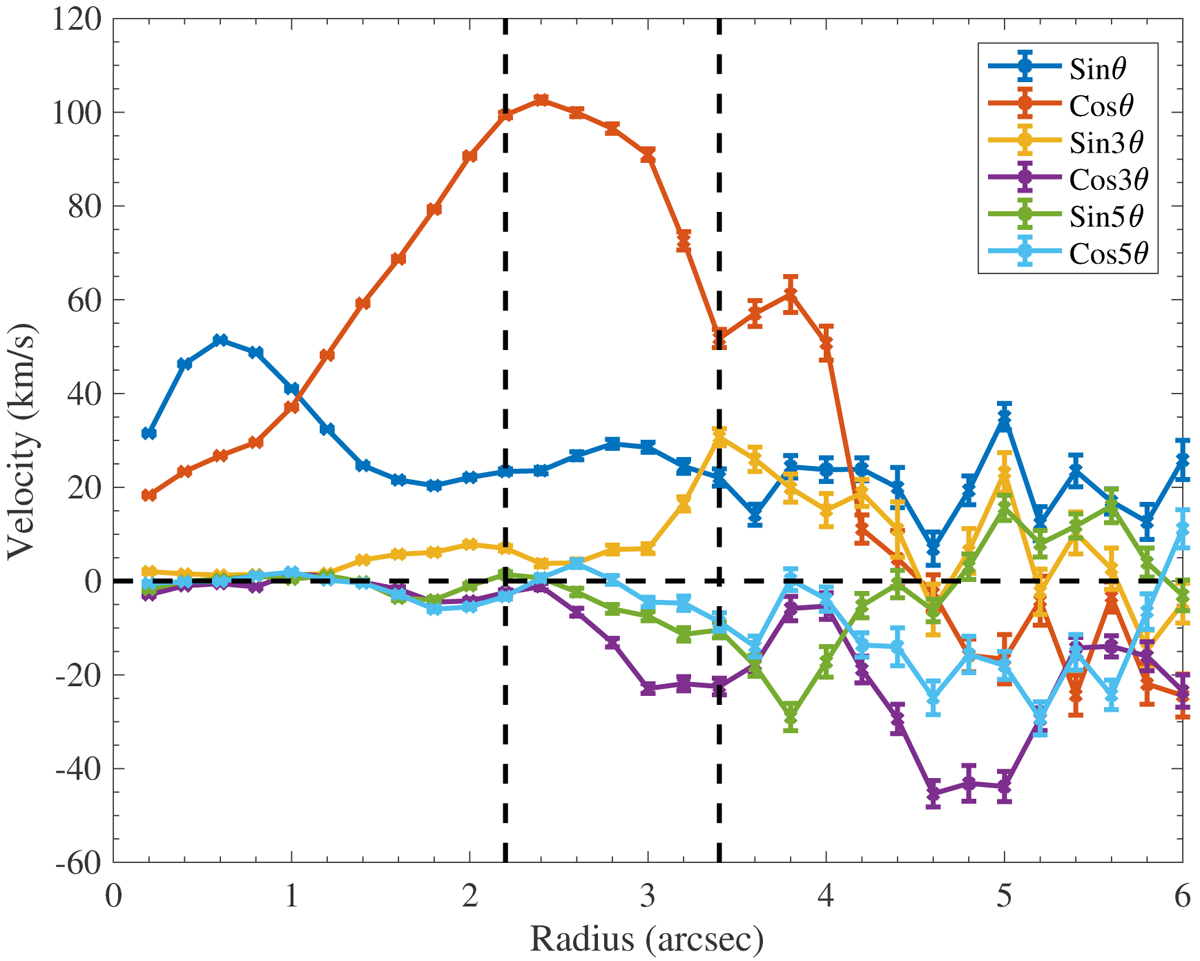
Amplitudes of the Fourier components obtained from the Kinemetry analysis of the CO velocity map, as a function of distance from the nucleus. The solid red line represents the coefficient of the cosθ term (pure circular rotation in a disk) and the other solid lines show the additional components (associated to perturbations) in the Fourier decomposition, following the colors specified in the inset. Only odd Fourier components were used. The vertical lines delineate radii at which we have abrupt changes in the fraction of pixels at a given radius which have values in the velocity map. At radii smaller than the left vertical line, this fraction is 1. Between the two vertical lines the fraction drops linearly from 1 to 0.5, and beyond 4″ the fraction is relatively steady at ∼0.3. The horizontal dashed line delineates zero velocity.
Current usage metrics show cumulative count of Article Views (full-text article views including HTML views, PDF and ePub downloads, according to the available data) and Abstracts Views on Vision4Press platform.
Data correspond to usage on the plateform after 2015. The current usage metrics is available 48-96 hours after online publication and is updated daily on week days.
Initial download of the metrics may take a while.