Fig. 4.
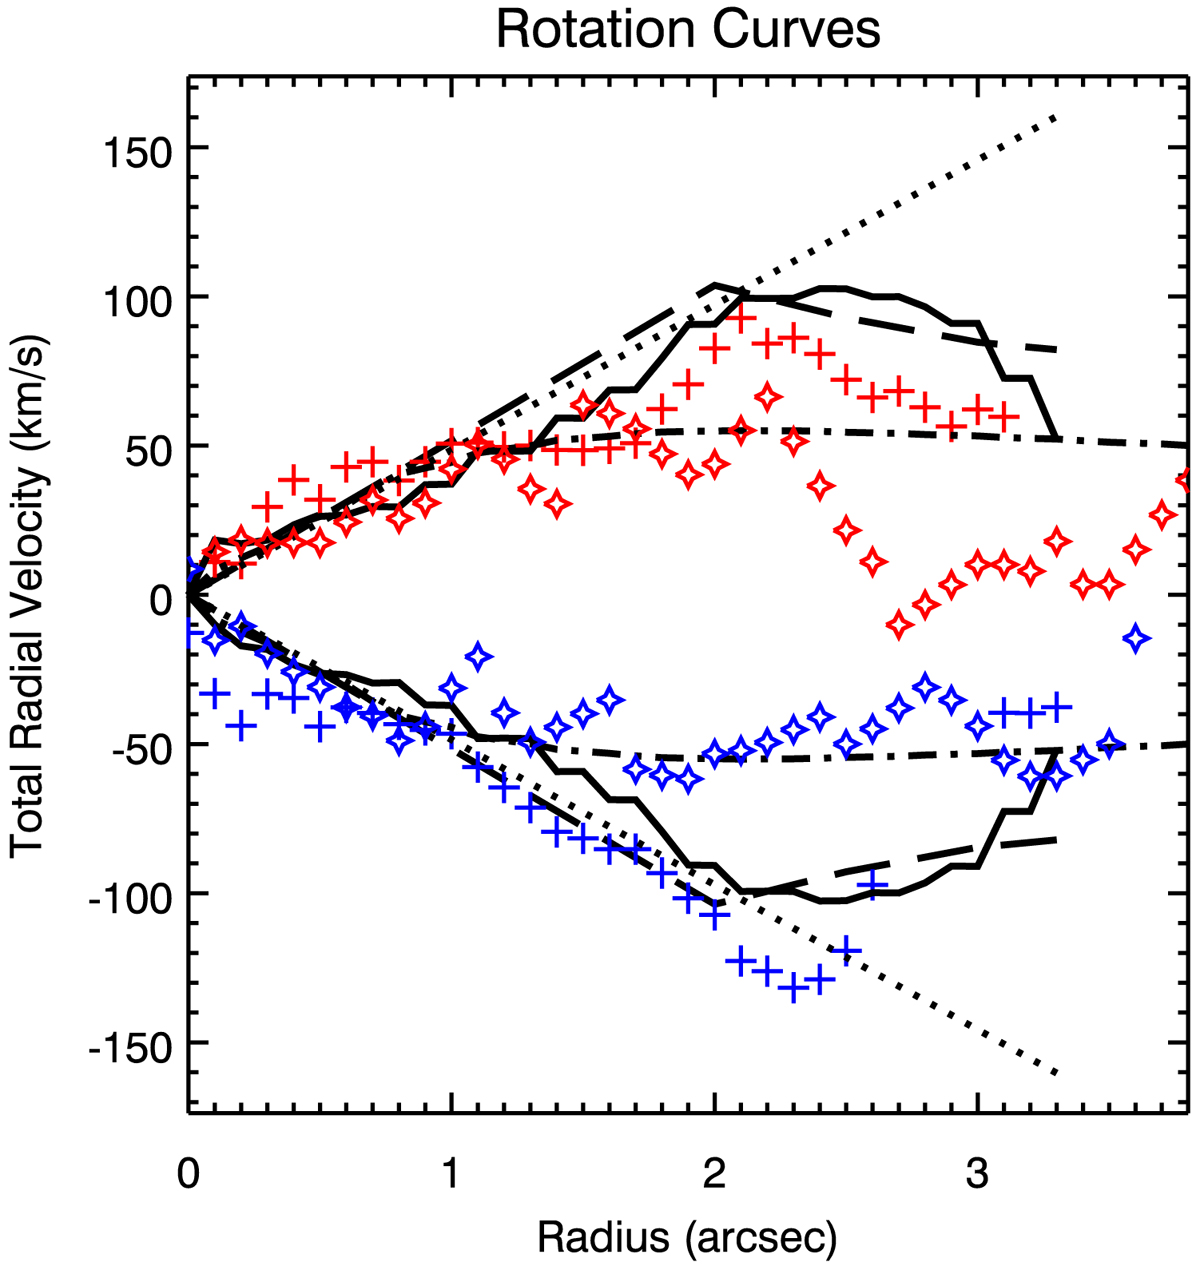
Comparison of the (projected) rotation models and observed velocities extracted along the major axis, in the central kpc of NGC 1566. The solid body model is shown with a dotted line, our ModC2014 model (see text) is shown with a dashed line, the circular (“gascirc”) model obtained by the Kinemetry fit to the CO J:2-1 velocity field is shown with the solid line, and the Bertola model fit to the stellar velocity field is shown with a dashed-dot line. CO J:2-1 and stellar velocities extracted along the major axis are shown with crosses and stars, respectively. Blue is used for the NE (approaching) side of the galaxy, and red for the SW (receding) side of the galaxy. The zero velocity on the y-axis corresponds to 1485 km s−1; at the nucleus, the velocity of the CO J:2-1 line is offset from this by −12.8 km s−1; a consequence of the asymmetric double-peaked profile of the nucleus, most likely caused by the effects of nuclear outflows and/or bar related perturbations.
Current usage metrics show cumulative count of Article Views (full-text article views including HTML views, PDF and ePub downloads, according to the available data) and Abstracts Views on Vision4Press platform.
Data correspond to usage on the plateform after 2015. The current usage metrics is available 48-96 hours after online publication and is updated daily on week days.
Initial download of the metrics may take a while.