Fig. 3.
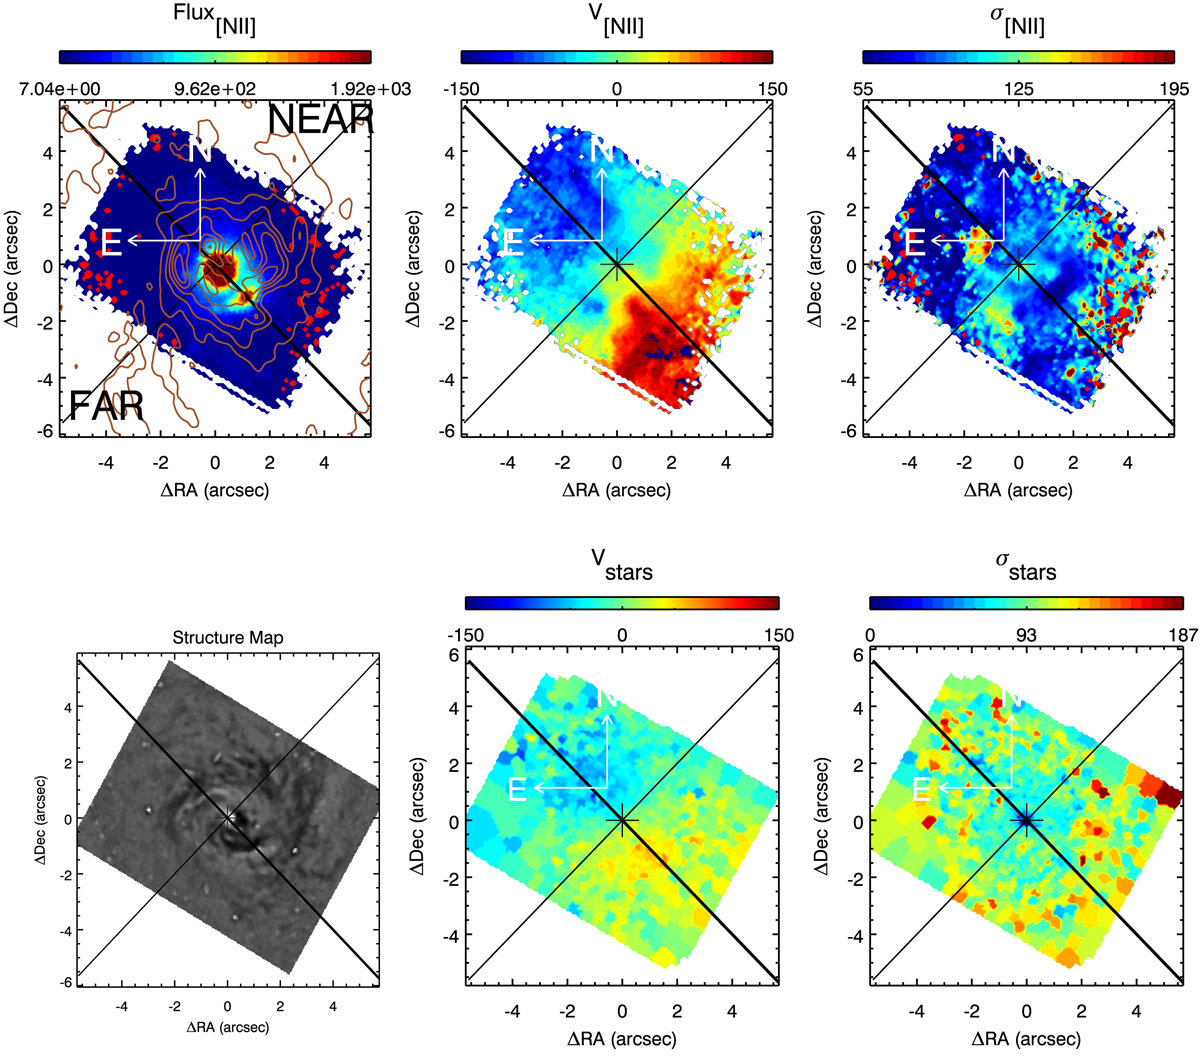
Top row: moment maps of the [N II] 6583 Å emission line in NGC 1566. From left to right, the panels show the 0th (integrated flux), 1st (velocity) and 2nd (velocity dispersion) moments. The nuclear position (marked with a cross) was derived from the peak flux of the continuum in Gemini-GMOS datacube, and the solid lines indicate the major axis (thick line) and the minor axis (thin line). In the moment 0 map (left panel), the brown contours show the integrated flux (moment 0) of the CO J:2-1 line. Bottom row: from left to right the structure map, and maps of the stellar velocity and stellar velocity dispersion. All maps have N to the top and E to the left (see compass). The structure map was created from a HST F606W filter on which unsharp masking was used to emphasize dust features. It is shown at the same size and orientation as the other panels.
Current usage metrics show cumulative count of Article Views (full-text article views including HTML views, PDF and ePub downloads, according to the available data) and Abstracts Views on Vision4Press platform.
Data correspond to usage on the plateform after 2015. The current usage metrics is available 48-96 hours after online publication and is updated daily on week days.
Initial download of the metrics may take a while.